There is poop in Iowa’s lakes and rivers! I’m sure you know this by now. The Iowa DNR monitors bacteria at 39 beaches every week during the summer and posts a “swimming not recommended” sign if the average for the month exceeds 126 E. coli/100mL. If a lake has a history of problems, another threshold (235 E. coli/100mL in a single sample) is used as an early warning system. As Iowa Environmental Council has reported, Iowa DNR issued 134 of these beach advisories last summer. Streams are monitored less often, but we can use the same thresholds to evaluate average conditions at the end of the season. Last year, all 15 streams that we monitor in Story County had E. coli levels above the primary contact recreation standard.
Story County Conservation posted a warning sign at the Tedesco Environmental Learning Corridor.
Okay, but what do we do with that information?!
I know some people who are so grossed out they won’t dip their toes in any lake or river in Iowa, even if the DNR says it’s okay. I know some other people who went ahead with a canoe trip on the Des Moines River, despite reports that just two days before, a broken sewer main in Fort Dodge had released 400,000 gallons of raw sewage into the river upstream of their route. They’ve paddled polluted waters before and figured it was no worse than usual.
Part of the difficulty is that some people translate “an unacceptably high number of beach advisories” to “lots of poop in the water everywhere all the time.” That’s not what’s happening. If you picked a summer weekend and a state park at random, and took your family to the beach, you would have had a 77% chance of swimming in water that met the primary contact recreation standard. If you subscribe to IEC’s Water Watch newsletter, you can make sure you pick the right one!
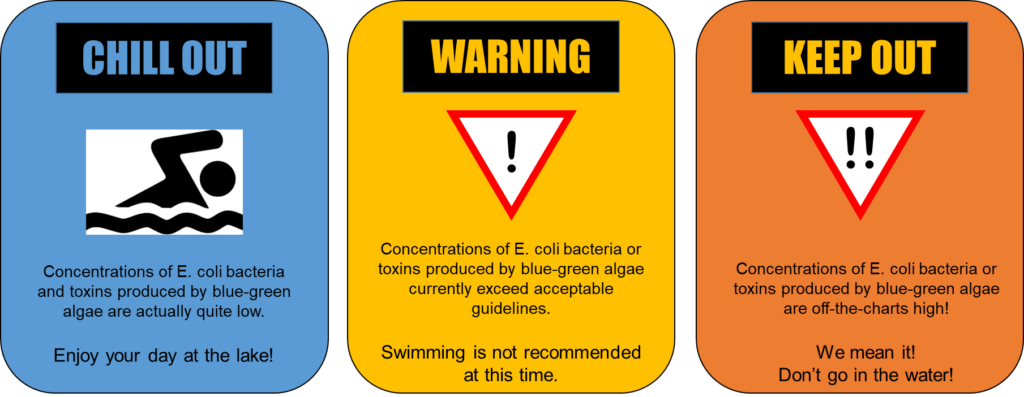
Part of the difficulty is that Iowa relies heavily on just one threshold to issue alerts and place waters on the Impaired List. Some other states have started used a red/yellow/green warning system that distinguishes between “swimming not recommended” at 235 E. coli/100mL and “beach closed” at 1000 E. coli/100mL. This is helpful if you’re a little more tolerant of risk or are doing activities that will keep your head above water. That upper limit is the same as the one used during the 2024 Summer Olympics to determine whether to hold swimming events in the River Seine.
Seine River in Paris, photo credit Erik Larson
You may recall that Paris spent $1.5 billion to clean up the Seine River in time for the 2024 Summer Olympics and still had to postpone some events because of poor water quality. Similarly, Story County Conservation has spent $3.4 million to restore Hickory Grove Lake and still had to post beach advisories four weeks last summer. There is no easy fix for these problems. However, a long-term perspective on water quality in the Seine shows how an open sewer can become a swimmable river (at least most of the time) with improvements in wastewater treatment. Yes, Iowa has more livestock than people, but I’ve been seeing some evidence that points to humans as the main source of feces and pathogens in many of Iowa’s waterways. If that’s true, then our water quality could benefit from projects to replace combined sewer systems (we still have a few), add liners to rusty sanitary sewers, get septic systems up to code, and make some overdue upgrades to sewage treatment plants.
Randy Evans was on the right track when he compared water quality in Iowa to water quality in Paris, but he only looked at one day. I’ve gone a few steps further. In the attached table, I’ve shown the best, worst, and average E. coli readings measured last year at some of Iowa’s most popular beaches and water trails. Below, I’ve put them in broad categories, benchmarked to some examples from France. I’ve also included some sites we monitor in Story County, in bold. Get ready to calibrate your disgust!
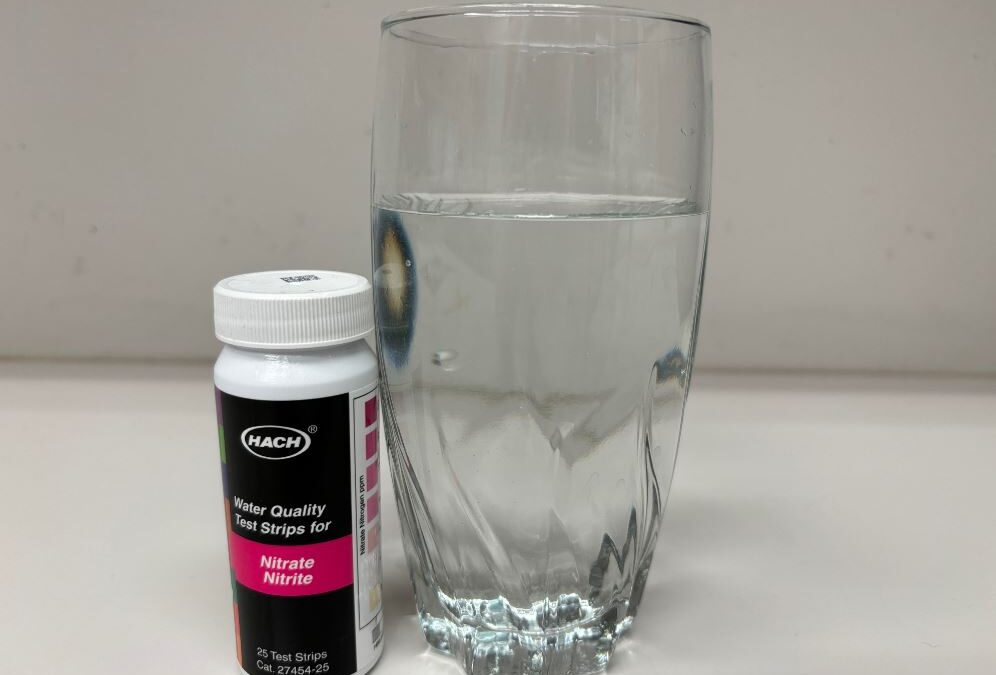
How do we measure poop in the water?
Escherichia coli is a species of bacteria found in the guts of birds and mammals. Some strains are harmless and some can put you in the hospital. It’s an easy-to-measure proxy for feces in the water, which could carry a wide variety of disease-causing microbes. E. coli can be measured directly by counting dots in a Petri dish (Colony Forming Units, CFU/100mL) or indirectly using a chemical reaction (Most Probable Number, MPN/100mL) but the results are similar enough that these units are often used interchangeably.
Typical laboratory protocols have a lower detection limit of 10 and an upper quantification limit around 24,000. With such a big range, E. coli data has to be plotted on a log scale and averages have to be expressed as a geometric mean or median—basically, worry less about the exact number and more about the number of digits.
1 digit: As clean as it gets without chlorine
Too low to detect, with typical methods (reported as <10)
A typical beach day at Peterson Park
A typical beach day at Lake Rathbun, Gray’s Lake, or Lake Okoboji
A good day at most lakes on the impaired list
Peterson Park Beach. A favorite spot for my family during COVID lockdown and consistently clean.
2 digits: Have fun in the water!
Meets Iowa’s primary contact recreation standard (geomean <=126, single sample <=235)
A typical day at a French stream running through forest or cropland
Treated effluent from Iowa sewage treatment plants with UV disinfection
A typical beach day at Hickory Grove Lake
A typical beach day at Lake MacBride (Iowa City) or Big Creek
A bad beach day at Peterson Park
A bad beach day at Lake Okoboji
A typical day at the Charles City or Manchester whitewater parks
A good day at most rivers on the impaired waters list
Kayaker at Manchester whitewater park. I tipped and swallowed water when I attempted it, but it was probably fine.
Low 3 digits: Swim at your own risk (families)
May exceed IA primary contact recreation standard (geomean >126, single sample >235)
A typical day at a French stream running through pasture
The Seine River in Paris during the women’s marathon swim
A typical beach day at Clear Lake or Lake Darling
A bad beach day at Lake Rathbun
A bad day at the Charles City whitewater park
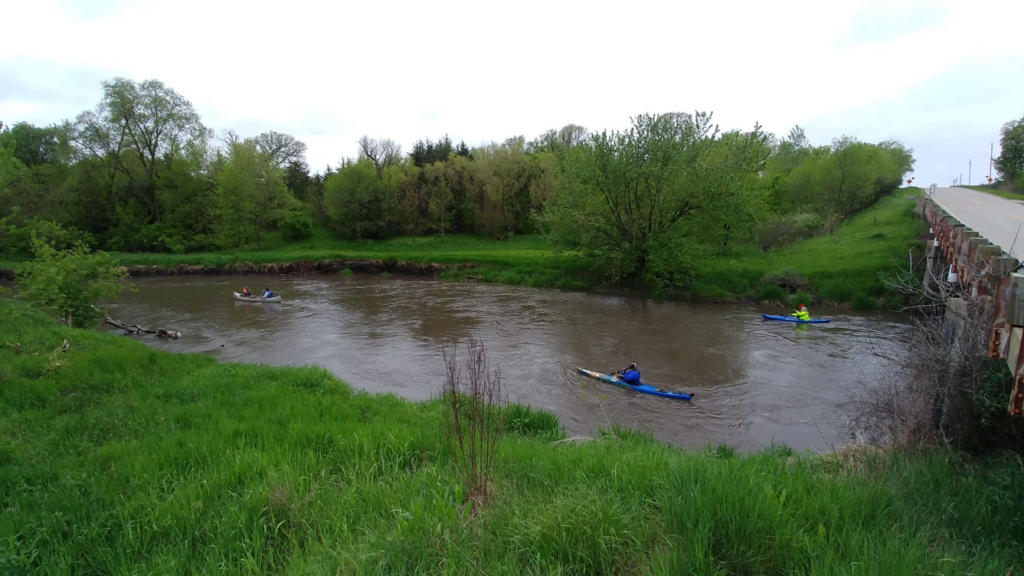
A typical day on the S. Skunk River water trail
Kids swimming at Clear Lake. No beach advisory on this day, but there had been other weeks.
High 3 digits: Swim at your own risk (athletes), canoe at your own risk (families)
May exceed Iowa’s secondary contact recreation standard (geomean > 630, single sample >2,880)
The Seine River in Paris during the men and women’s triathlon
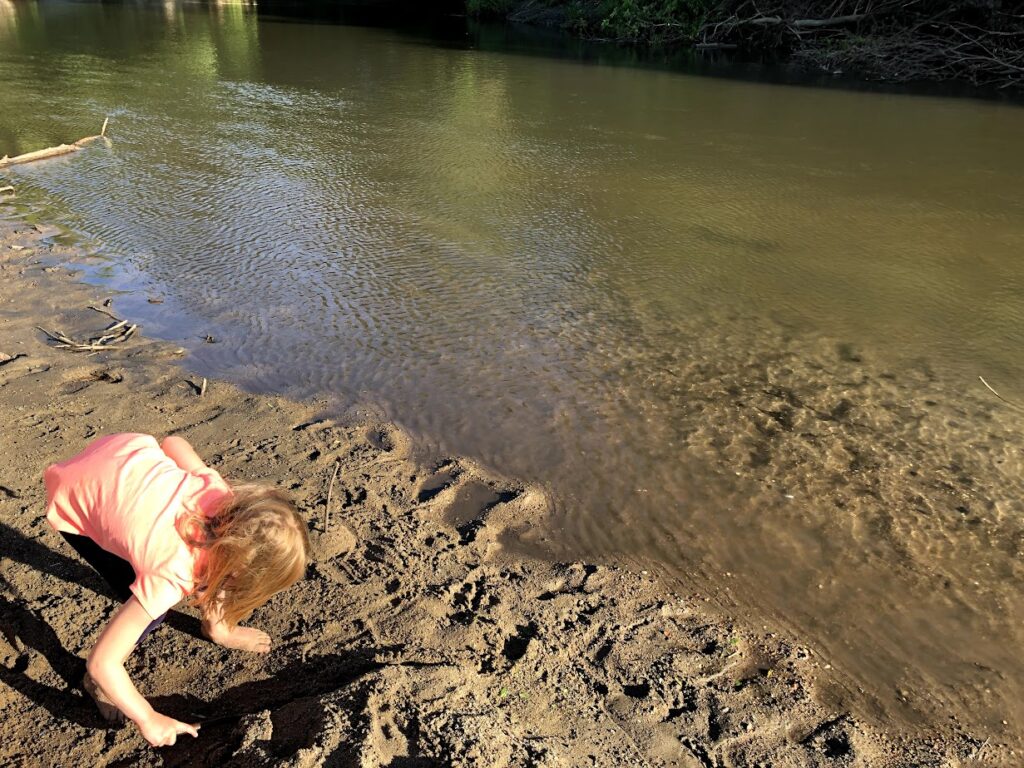
A typical day at Ioway Creek in Ames
A typical day on the lower Maquoketa River (near Spragueville)
My daughter playing on a sandbar in Ioway Creek in Ames. I’m sad to say it, but I don’t think kids should be playing in this water.
4 digits: No swimming, canoe at your own risk (experienced paddlers)
Action limit for beach closures in some states (single sample > 1000)
A bad day for the Seine at the 2024 Olympics; men’s triathlon postponed
A typical day for the Seine in the early 2000s (since improved sewage treatment, but before sewer system improvements)
Treated effluent from modern Paris sewage treatment plants
A bad beach day at Gray’s Lake, Lake MacBride, Big Creek, Clear Lake, or Lake Darling
A typical day at West Indian Creek, downstream of an outdated sewage treatment plant
A bad day on the Skunk River or Ioway Creek (1.5 inch rain previous night)
A bad day at the Manchester whitewater park
Canoe trip on Ioway Creek in Boone County. I collected a water sample at this moment. E. coli measured 2,390 CFU/100mL.
5-6 digits: Stay out of the water
May be too numerous to count, with typical methods (reported as > 24,000)
A typical day for the Seine in the 1980s, before modern sewage treatment
A bad day on the Seine River in 2008, before attempts to control combined sewer overflows
A bad day at West Indian Creek (1.5 inch rain previous night), downstream of an outdated sewage treatment plant
Flash flooding in the Skunk River or Ioway Creek (June 2022). No one should be in the water during these conditions.
Two bad days on the lower Maquoketa River (near Spragueville), during high water levels
A bad day at Hickory Grove beach. Previous studies have shown that the main source of the bacteria is geese and dogs at the beach.
The new Nevada sewage treatment plant should be operational this year and will have a UV disinfection system like this one. This should make it safer for kids in Maxwell to play in Indian Creek.
Cracked sanitary sewer in Ames leaking into Ioway Creek, September 2009
No picture for this one. You’re welcome!
What is the risk of poop in the water?
Recreational water quality standards are based on epidemiological studies at swimming beaches. Researchers have found that swimmers were more likely than non-swimmers to get sick with gastroenteritis (“stomach flu”) and that illness rates were higher at beaches with more fecal indicator bacteria. Symptoms can range from mild to dangerous and are often falsely attributed to food poisoning. The EPA recommended a threshold of 126 E. coli/100mL to keep the risk of illness below a certain level for swimming, water skiing, children’s play, and other “primary contact” activities, but you should think of it as a point on a continuum rather than sharp break between “safe” and “unsafe.” Secondary contact recreation standards are used less often and involve some adjustment factors.
There are many factors that can influence whether you get sick while at the beach—how much water you swallow or get on your face, whether the source of the feces is human or animal, your general health, and previous exposure to the pathogens. There are also some challenges in accurately quantifying E. coli levels in water, which can vary a lot even within the same body of water and over a short period of time. I ran across a randomized control trial from Germany that controlled for all these factors. Some 2000 people were recruited to spend an afternoon at one of four locations (3 lakes and 1 river). Half stayed on shore and half were asked to spend ten minutes in the water, dunk their head at least three times, and report if they accidentally swallowed water. Water samples were collected every 20 minutes from the center of the swimming area and tested for E. coli. Researchers tracked how many people got sick over the next week with symptoms of a waterborne illness. Here are the results.
Water quality (E. coli/100mL), by quartile
Incidence rate of gastroenteritis
Control group
2.8%
0 to 72
1.9%
72 to 181
5.2%
181 to 379
6.6%
379 to 4,600
8.2%
What about really polluted water? An academic review board would never approve an experiment to send 931 people into a bay polluted by a combined sewer overflow, but a group of Danish triathletes was reckless enough to do it for fun. After swimming 3.8 km in water with an estimated 15,000 E. coli/100mL, 42% of them got sick with Campylobacter, Giardia, or E. coli!
There you have it, these are ballpark, intuitive judgements about when to go in the water and when to stay out, but they are informed by good science. Oops, did I just give health and safety advice without running it by anyone?
Prairie Rivers of Iowa is not a medical professional and our work is not conducted under a DNR-approved quality assurance plan, please consult your doctor and refer to section 567-61.3(3) of the Iowa Code, terms and conditions apply.
Bottom line, you may disagree with the interpretation I’ve outlined here, but there’s clearly a lot of wiggle room to enjoy Iowa’s waters without taking unnecessary risks with your health.
Rain gardens are a stormwater management solution that’s simple enough to tackle as a DIY project: dig a shallow basin to intercept runoff from a downspout or paved area, plant it with ornamental grasses and flowers, and pat yourself on the back for doing your small part to prevent flash flooding, streambank erosion, and water pollution! However, I’ve noticed a few things that can go wrong. Here are some tips to avoid them!
These tips also apply to the bioretention cells you’ll see in public right-of-ways, which are similar, but have an underdrain and an engineered soil mix.
Standing Water
A rain garden may fill up with water after a heavy rain, but it should soak into the ground within 24 hours. This will prevent mosquitos from breeding and allow a wider variety of plants to thrive. To achieve this, you either need to find a spot with well-drained soil, or you need to amend the soil with sand and compost. It’s important to test the infiltration rate of the soil: a 6 inch deep rain garden would need soil that can infiltrate at least 0.25 inches of water per hour.
This bioretention cell has turned into a cattail marsh, with standing water for extended periods in the spring. I tested the soil for a school project and determined that the soil had too much clay content and had been compacted during construction.
Erosion and Debris
There are guidelines for how big to make a rain garden to handle the runoff from a given area. However, if space is limited, an undersized rain garden is better than no rain garden. The trick is to manage the overflow.
This rain garden treats the runoff from a church parking lot. Once the water level gets high enough, it enters a pipe that connects with the storm sewer. This pipe was installed in response to concerns about soil and mulch washing onto the sidewalk when water overtopped the berm. We installed a mesh barrier to keep woodchips from clogging the outlet. I’ve heard that shredded hardwood mulch is less prone to floating than wood chips and bark nuggets.
One other issue with this rain garden was erosion as water made its way from the pavement to the low point. To solve this problem, I regraded the basin so it had a level bottom (using a line level, rake, and shovel), and put some stones and gravel at the edge of the pavement to absorb the force of the water.
Dead plants and weeds
There are many lovely species of native plants that can thrive in a rain garden, once established, but as seedlings they may struggle to withstand alternating periods of flooding and drought. To improve their odds of success, you can redirect the downspout or plug the opening to the rain garden for a few months, irrigate, and protect them from rabbits and deer. If that’s not possible, expect to replace a few plants.
Just like any other garden, a rain garden can get overrun with weeds, especially when the desirable plants are just getting started. Sturdy labels or ID guides can help whoever is responsible for maintenance know what to pull and what to keep, but for a situation like this (a highly visible commercial right-of-way managed by the city) simpler planting plans are probably better.
I hope this article helps you avoid some common pitfalls but doesn’t discourage you from trying. I planted a rain garden in my backyard last spring and have already enjoyed some blooms and monarch butterflies!
This letter is a satire of DNR’s latest response to the EPA’s partial disapproval of Iowa’s 2024 Impaired Waters List. My first impression was that this was a technical dispute with low stakes for water quality and industry. In theory, adding waters to the 303(d) list can result in stricter permit limits on point sources and open up grants for non-point source projects, but in practice there are many loopholes and backlogs that make that unlikely. However, it still matters whether Iowans are getting honest information about the condition of our waters from the agency charged with protecting them. Iowa DNR’s position is ridiculous and indefensible.
To the attention of the US Environmental Protection Agency, Region 7:
Dear Sir,
In your November letter, you stated that Iowa’s 2024 Impaired Waters List should have included six more river segments that are too polluted by nitrate to fully support drinking water uses. The Iowa Department of Natural Resources strongly disagrees and objects to the implication that Iowa’s water is unsafe, or that DNR is not meeting the letter or the spirit of the Clean Water Act.
Just to be clear, we’re not talking about whether the water is safe for fish or swimming. Toxic algae blooms are a separate issue, for which nitrate is at most a contributing factor. Okay, good we’re on the same page. It’s impossible for most waters to end up on the 303(d) list because of nitrogen or phosphorus pollution, because we still haven’t set numeric criteria to protect aquatic life. The 10 mg/L standard for nitrate applies only to the 61 reservoirs and 18 stretches of river that were designated Class C waters, because they are currently or were historically used as a major source of drinking water.
Ultimately, the goal of EPA and DNR is the same: to ensure that Iowa’s drinking water is safe. It is safe! Well… maybe not for adults. We have the second highest cancer rate in the nation and there is growing evidence that one of the risk factors is long-term exposure to moderate levels of nitrate in drinking water. But nobody is seriously proposing we do anything about that! The issue here is whether tap water is safe for babies, whether nitrate-nitrogen is below the Maximum Contaminant Level of 10 mg/L, as required by the Safe Drinking Water Act.
I’m happy to say that water utilities on these six rivers have been able meet that standard by either:
Mixing high-nitrate river water with low-nitrate water from wells and reservoirs
Asking customers to cut back on water use during times when the reservoir has a toxic algae bloom
Drilling enough wells so they no longer have to use any river water
What, you don’t think giving up on polluted rivers is consistent with the spirit of the Clean Water Act? Hey, if it works… Oskaloosa switched its water source from surface water to an alluvial aquifer years ago, and those wells usually have low nitrate levels. That means that even though we’re still legally required to assess nitrate in the South Skunk River, we no longer have any practical reason to worry about it! Granted, alluvial aquifers are still susceptible to contamination from the adjacent river. Cedar Rapids recently saw nitrate in their wells rise to 9 mg/L, but we’re crossing our fingers that it doesn’t get worse.
Let’s get back to the main issue under dispute. We’re not talking about water quality in 2024, we’re talking about the assessment that we released in 2024, which uses water quality data from 2020-2022. The silver lining of a multi-year drought is lower nitrate levels in the rivers! We are not talking about whether a single sample of river water exceeds 10 mg/L, we’re talking about whether 10% of the samples exceed 10 mg/L.
Sure, a single sample of finished tap water exceeding the 10 mg/L MCL for nitrate would constitute a Tier I violation of the Safe Drinking Water Act, requiring public notice and corrective action. However, so long as that corrective action is needed less than 36 days each year, we think it’s fair for the burden of removing nitrate from the water to fall entirely on drinking water utilities and their customers rather than polluters.
What, you don’t think this 10% threshold for evaluating the source water makes any sense? Well too bad! We’ve gotten away with doing it this way for decades and calling us on it now would violate the no-take-backsies clause of the Administrative Procedures Act. You’ve made the mistake of focusing on the letter of the law rather than the spirit of the law and we can argue about which pollutants go on which list, which list can be assessed using the 10% binomial statistical exceedance approach, and what hoops you need to jump through to change anything until babies are blue in the face!
Should this arbitrary and capricious abuse of federal authority stand, we might someday have to write a Total Maximum Daily Load (TMDL) explaining why it’s impossible to clean up nitrate in the South Skunk River, Des Moines River, and Iowa River. If you carefully read the TMDLs and permits that we’ve already prepared for the Cedar River and Raccoon River watersheds, you’ll see that would be a waste of our limited staff time and paper.
Nitrate in drinking water is under control. Please stop talking about it. If we must talk about nitrate, we prefer the discussion be framed around Gulf Hypoxia and the Iowa Nutrient Reduction Strategy, because that makes the problem seem far away and less urgent.
In November, the EPA partially approved Iowa’s 2024 Impaired Waters List, adding six additional river segments where drinking water use is impaired by high nitrate levels. I think EPA was right to do this, but I have some concerns. This is the letter I submitted during the public comment period.
Dear Water Division Staff,
I agree with the EPA’s decision to add seven river segments to Iowa’s impaired waters list. I hope that this change will lead to greater transparency about how nitrate pollution of surface waters affects the cost and safety of drinking water, but am concerned there will be unintended consequences.
Iowa’s Credible Data Law has sometimes been a convenient excuse to assess fewer waters, and thereby discover fewer problems. However, that doesn’t seem to be the issue here. Each of the water bodies on this list had at least one “credible” nitrate sample exceeding the 10 mg/L drinking water standard during the three year assessment period.
Raccoon River near Des Moines: 38 of 755 samples collected by Des Moines Water Works exceeded 10 mg/L
Cedar River near Cedar Rapids: 1 of 36 samples collected by the USGS, and 7 of 151 samples collected by Cedar Rapids Water Works
As I understand it, the issue is the threshold for impairment. Since fewer than 10% of the samples (accounting for some statistical correction factor) exceeded 10 mg/L, IDNR says these sites meet the standard. EPA says they do not.
The Iowa DNR’s position is not defensible. In the draft 2024 assessment, Raccoon River near Des Moines was shown as fully supporting its designated use for drinking water because
A) Nitrate in the Raccoon River exceeded 10 mg/L nitrate less than 10% of the time during the 2020-2022 assessment period
B) Nitrate in finished drinking water at the Des Moines Waterworks never exceeded 10 mg/L.
This makes no sense. Even one sample exceeding the Maximum Contaminant Level for nitrate would constitute a violation of the Safe Drinking Water Act, requiring public notice. To avoid this, the Des Moines Waterworks had to run its nitrate removal facility for weeks in 2022 at a cost of $10,000 a day, as well as blending water from other sources and asking residents to reduce water use. Clearly, poor water quality is limiting that beneficial use of the river water!
However, the South Skunk River no longer supplies drinking water to the City of Oskaloosa. The City now gets its water from an alluvial aquifer, and is able to achieve low levels of nitrate in finished water (1.17 mg/L, in the latest Consumer Confidence report) without expensive treatment. I understand that the Clean Water Act does not allow designated uses to be removed if restoring them is still achievable. However, I hope that in prioritizing and writing TMDLs we can be cognizant of facts on the ground. In the unlikely event that a TMDL for the Skunk Skunk River is written and it leads to stricter effluent limits for upstream point sources, we might be imposing real costs on Ames, Story City, and Nevada without achieving real benefits for Oskaloosa.
I am also concerned that disallowing the 10% binomial rule might lead to further politicization of funding for water monitoring. Water quality in rivers is highly variable, and daily or weekly monitoring might pick up on a short-term spike in nitrate that is missed by monthly monitoring. If a single sample can trigger impairment but there are no rules on how often a site has to be monitored, cutting budgets for monitoring programs becomes a tempting way to evade regulation and controversy.
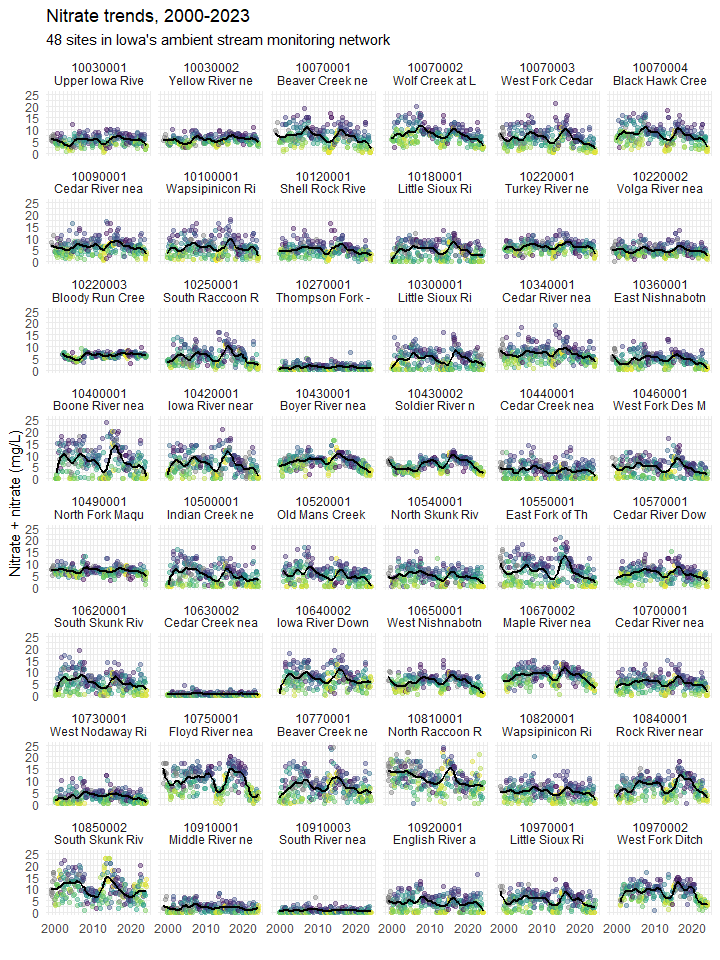
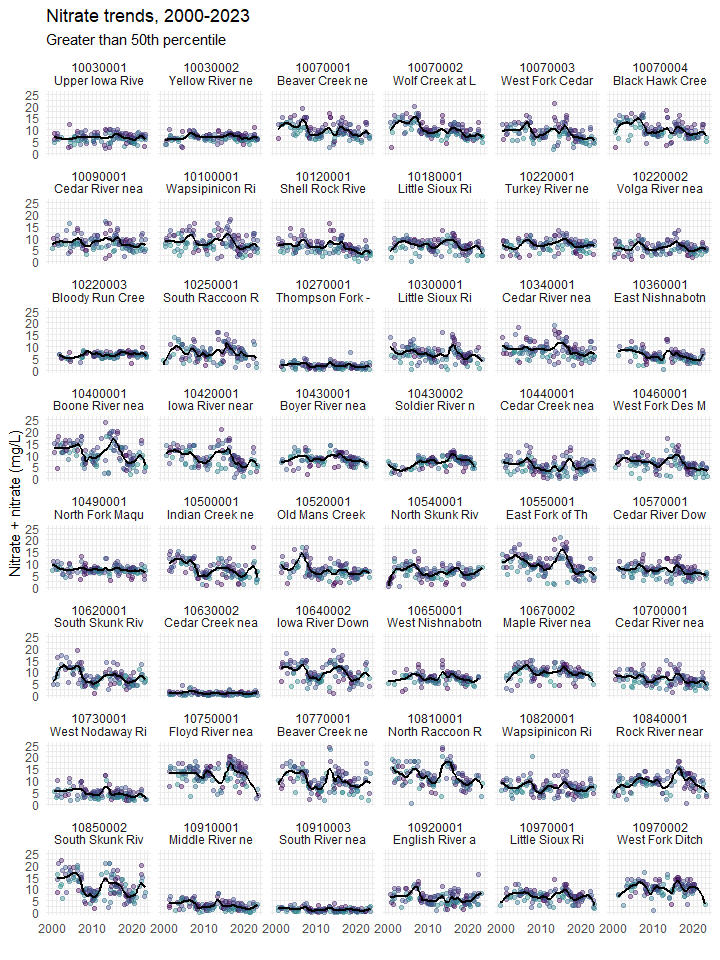
Our grant from the Water Foundation gave me an excuse to dive deep into a big statewide dataset collected by the Iowa DNR. I presented some of that analysis (along with general tips for data analysis) at the Iowa Water Summit in October. Since my slides rarely make sense without the narration, I have also written up a series of set of three case studies about trend monitoring.
I started learning R, a computer programming language for data science and statistics, in 2020. There was a steep learning curve, but now I get to coast downhill. If I can make an interactive map to display which chloride and phosphate readings from a volunteer event fall into the “good” category, I can reuse a lot of that code to make another interactive map that shows which lakes meet the recreation standard for E. coli. If I can figure out how to overlay maps of watersheds and animal feeding operations to calculate livestock density for 60 monitoring sites, it’s not hard to adapt that to calculate a similar metric for wastewater treatment plants. If I can make a good graph for one site, it’s not hard to scale that up to 50 sites.
Behold! My finest graph yet! On a single page, you can see 20 years of monthly nitrate data for the 48 sites in Iowa’s Ambient Stream Monitoring network with the longest record. The dots are color-coded to show streamflow at the nearest gage on the day the water samples were collected, yellow when water levels were at their lowest and grading to purple when water levels were at their highest. The black line is a 3-year moving average (or at least a close approximation with LOESS). You’ll notice that nitrate levels in most streams shot up sometime around 2014 and have been declining since. But how much of that is a precipitation-related trend tied to the El Niño-Southern Oscillation and how much is due to conservation efforts in the watershed?
Here comes the magic trick! Watch closely, for when I place into my hat all those samples collected when streamflow was lower than average (yellow and green dots) some of these apparent nitrate trends will…. disappear!
Darn it, that didn’t work at all! For the third of three case studies I’ll link to below, I take a closer look at two of these sites: Black Hawk Creek, where I’d expect a moderate improvement based on cover crop acreage and the East Fork of the Des Moines River, where I’d expect very little improvement. The East Fork actually has a much bigger nitrate trend than Black Hawk Creek and I can’t account for it. Maybe I should give up and leave trend monitoring to the experts at Iowa State University and Iowa DNR, they seem to know what they’re doing (see Danalatos et al. 2022).
However, the trick did work when I compared a watershed impacted by mostly point sources of pollution (i.e. sewage treatment plants) to a watershed impacted by mostly non-point source pollution (i.e. agricultural runoff). This is the first of the three case studies. Phosphorus concentrations have increased in the North Raccoon River and decreased in the South Raccoon has decreased, but that’s entirely due to recent drought. The second case study introduces a new metric for identifying rivers that a strongly influenced by point source pollution, and how to track improvement.


 have taken over this bioretention cell")