Think Outside the HUCs

Think Outside the HUCs

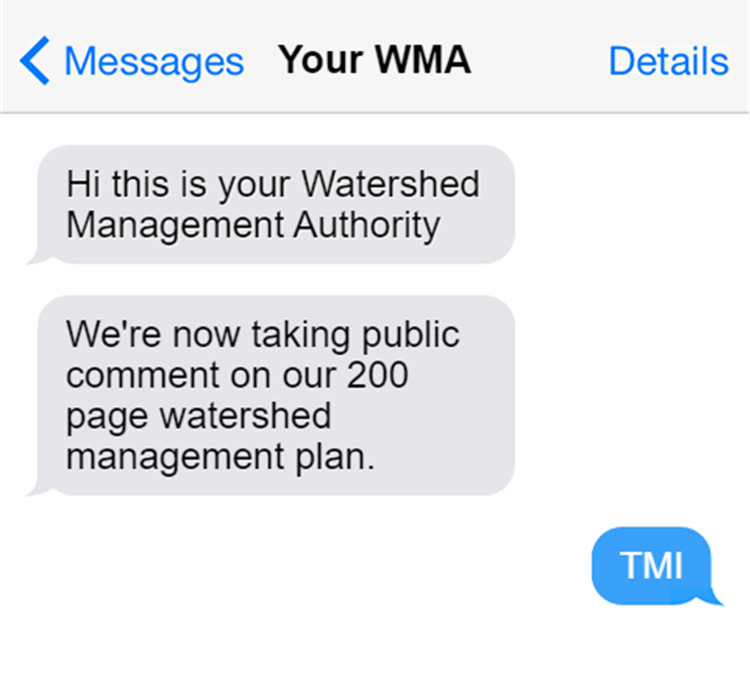
“With the Nutrient Reduction Strategy approaching its 10-year anniversary in 2023, Iowans deserve to see water quality results from the nearly $100 million of public money invested since 2013.  Water monitoring is a crucial component to the success of the Nutrient Reduction Strategy and must be designed to assess progress.  A strategy without a way to evaluate progress or outcomes is not a real strategy.”

– from Iowa Environmental Council’s 2022 report:  “Water Quality Monitoring and the Water Quality Initiative

fake text message to introduce blog post

Most water monitoring programs are NOT designed to assess progress.  Often, people don’t begin monitoring in earnest until the grant funding arrives for an improvement project (or on flip side, until an industry with a reputation for pollution sets up shop in the area).  Often, they’re hoping for preliminary results when the grant wraps in 3-5 years.  I’ve been down that road, completed a horrifying statistical analysis, and left this conference poster as a warning to others: “Progress tracking is not a realistic use for typical stream monitoring approaches”.

Our local partners in Story County took this warning to heart and made a plan to sustain water monitoring for at least ten years, while shifting our focus.  We collected lab samples from more sites (less often, and with less hassle) while ramping up the volunteer program, so we could engage the public and get a baseline understanding of water bodies all around the county.  All is well and good.  But now and then I come back to the question “how would you monitor water if you were serious about assessing progress?”.

Preliminary results in 3-5 years might be feasible if you already have baseline data for comparison, and account for any big changes in weather.  The South Skunk River just upstream of Ames was monitored from 2001-2014 by the Iowa DNR, and we resumed monitoring it in 2020.  I have good news and bad news for the newly formed Headwaters of the South Skunk River WMA.

  • Good news: average nitrate concentrations over the last three years have declined 46% compared to the baseline period.  Mission accomplished?
  • Bad news: the trend goes away if you exclude samples collected during a drought when nitrate levels are at their lowest.
nitrate trend in south skunk river above Ames

Study design is key for progress tracking.  In order to be sure that water quality really changed, and to be able to link that change to something that happened in the watershed, scientists approach water monitoring like a medical trial.  To do it right, there should be a treatment group (a watershed that receives conservation funding and attention), a control group (a nearby watershed that doesn’t receive funding), a before period, and an after period.  There should be a full accounting of land management and conservation practices in both watersheds.  If the treatment group improves more than the control group, that’s a good sign the medicine works.  At the time we wrote the Story County Monitoring Plan, doing a paired watershed study of the sort that Michelle Soupir did for Black Hawk Lake didn’t make a lot of sense.

It didn’t make sense to invest in progress tracking, because our WQI-funded watershed project had come to a close, further funding was uncertain, and we couldn’t expect much improvement in water quality based on other metrics to date.  Our watershed coordinators worked really hard, we had enthusiastic partners in local government and agribusiness, and we organized some well-attended field days where we heard from inspiring early adopters of cover crops and bioreactors.  We met some farmers in the watershed who cared enough about soil and water to take a risk and try something new.  Unfortunately, at the end of four years, we had a lot of unspent cost share funds and only enough conservation practices to expect or 1 or 2 percent reduction in nitrogen and phosphorus.  Ioway Creek is a big watershed (147,000 acres).

metrics from wqi project

However, this year I was reviewing our water monitoring data and had one of those moments like when you squint at an optical illusion and suddenly see a rabbit instead of a duck.

“Hey, that looks a lot like an upstream/downstream study for tracking whether projects in the Ioway Creek watershed and the City of Ames have improved water quality!”

  • The medicine: A bunch of conservation practices were installed between 2015 and 2019, some of which address nitrogen and some of which address other pollutants. We could include Jean’s no-till fields in Hamilton County, Jeremy’s cover crops in Boone County, Gerold’s bioreactor in Boone County, the UV disinfection system in Gilbert, the permeable parking lot at Ames City Hall, the stream restoration and saturated buffer at the Tedesco Environmental Learning Corridor, and many others.
  • The treatment group: A downstream site, influenced by all those conservation practices. The South Skunk River at 265th St. has been monitored weekly by the City of Ames since 2003.  At this point the river drains 573 square miles, corresponding to the Ioway Creek watershed plus the Headwaters of the South Skunk River watershed.
  • The control group: An upstream site, not influenced by these practices. At this point, the river drains 316 square miles, corresponding to the Headwaters of the South Skunk River watershed, minus any land within Ames city limits.
  • A before period: Both sites were monitored between 2003 and 2014.
  • An after period: Both sites were monitored between 2020 and 2022.

And then I made a boxplot and squinted a little more and said, “Hey, it looks a lot like nitrate has improved at the downstream site!”  Same thing for E. coli!  Maybe there’s more to this story than just cost-share metrics.

graphs comparing nitrate at upstream and downstream sites

The analysis is described in more detail in our 2022 annual report on water monitoring in Story County.  We’ll also have some opportunities this year to talk with other groups around the state that are doing water quality monitoring and swap some tips and tricks.

Here’s one of mine. To see the “rabbit” in this data, you have to be flexible in how you think about watersheds.  A watershed is just the land area that drains to a common point.  With the right tools, we can delineate a watershed for any point of interest on the river network.  I’ve taught several classes of ninth graders how to do this.  Neither of these sites are in the Ioway Creek watershed, and they aren’t mentioned in the Watershed Plan, but that doesn’t mean they’re not relevant.  The US Geologic Survey’s system for mapping and numbering watersheds is convenient for many purposes.  But if you have access to long-term monitoring data, don’t be afraid to think outside the HUCs!

An Impressive 2022 Stream Monitoring Season

An Impressive 2022 Stream Monitoring Season

Jess Lancial testing water

Jess Lancial testing water quality (photo credit Story County Conservation)

Volunteer Water Monitoring in Story County

A round of applause for all the volunteers and Story County Conservation staff who have diligently been monitoring their assigned stream twice a month in all kinds of weather!   Also, let’s give a shout-out to the people who work behind the scenes.  Sara Carmichael of Story County Conservation keeps everyone on track and equipped with supplies.  Heather Wilson of the Izaak Walton League of America provides training and support to volunteers around the state.  We rely on the IWLA’s  Save Our Streams program for training materials and the Clean Water Hub for data entry.  The three of us will be meeting the volunteers at a training event later this month to kick off another great season.

Three ways to get involved:

  • There’s room for one or two more volunteers to cover a site in Story County, so contact Sara.
  • If you’d like to try water monitoring without committing to a schedule, Prairie Rivers organizes a one-day volunteer event in the Ames area each May, so keep an eye on our events page.
  • If you don’t live in Story County, the Izaak Walton League is launching a new Nitrate Watch program and you can request a bottle of test strips while supplies last.

In March, Prairie Rivers will release a report detailing the findings, but for now let’s admire the scale and consistency of the effort, which has really improved since last year. (Updated 2023-02-18 to include some data sheets that were entered late)

2022 Season

Volunteers participating

Sites tested at least once

Sites tested at least 10 times

Sites tested at least 20 times

Data sheets entered in the Clean Water Hub

2021 Season

Volunteers participating

Sites tested at least once

Sites tested at least 10 times

Sites tested at least 20 times

Data sheets entered in the Clean Water Hub

Story County Water Monitoring & Interpretation Plan, 2021-2030

Prairie Rivers partnered with Story County and 8 other organizations to develop a ten-year Water Monitoring & Interpretation Plan for Story County.  Regular communication between the various groups testing water helps avoid duplication and leads to new opportunities to improve water quality.  Planning for how data can be used over the long term ensures that we get the most value from our time and effort.   Read the plan here

Clean Water Act: 50 years, 50 facts

Clean Water Act: 50 years, 50 facts

 “The Clean Water Act: 50 Years, 50 Facts” will be a weekly series of short videos on our Instagram and YouTube channels, celebrating the 50th anniversary of the Clean Water Act, and focusing on rivers and lakes in Iowa.  At the time I wrote this, we had published the first four episodes and recorded material for the next four.

The Clean Water Act is a law that works best when concerned citizens are paying attention and speaking up, so it’s worth the trouble to make sense of legal jargon like a point source, 303(d) list, 319 grants, NPDES permits, and the ordinary high water mark.  Yikes! We’ll cover these topics and more in accessible and bite-sized chunks!

Environmental policy can be a dry subject, so we’re having some fun with it!  I take full responsibility for the theme music, inspired by a Steely Dan hit that debuted a month after the Clean Water Act.  You can thank Daniel Huber and Mike Kellner for making the videos pretty and putting them out there; I’m clueless when it comes to social media.

The videos are less than 90 seconds and are best viewed on a smartphone in portrait mode.  The first few were me talking from my office, but I’ve already started taking field trips (Fact #6 was filmed in front of an effluent pipe) and I hope to feature guests whose job or advocacy work intersects with the Clean Water Act.

The Clean Water Act is a big law.  I know a lot about some pieces and very little about other pieces.  My reference books for the series will be EPA’s Watershed Academy Web and River Network’s Clean Water Act Owner’s Manual.  If I overlook something, you’ll hear from my “fact-checker” in the description or comments section.

Clean Water Act Owners Manual

I want this to be relevant, so I will sometimes follow up on a fact with some commentary or include a link to policy recommendations from other organizations.  For example, here’s a report from the Environmental Integrity Project on how to close the gap between the CWA’s goals and reality. Yes, I work for an environmental organization and we would like some more environmental protection, please.

However, I can understand why many people see environmental regulation as burdensome.  I hope that a better understanding of how the system works (or doesn’t work) could help us find some common ground.  My perspective on environmental law is informed by a stint at the Wisconsin Department of Natural Resources where I learned how complicated it can be to fill a small amount of wetland legally, and how often people got away with filling a large amount, illegally.  What if fewer projects needed a permit, but we had tougher enforcement?  Wouldn’t that save more wetlands on balance, while leveling the playing field and reducing compliance costs for most businesses?

And if common ground is out of reach in today’s political climate, hey, it’s just some short videos.  Enjoy!

You can lead a horse to water…

You can lead a horse to water…

Prairie Rivers of Iowa is not the sort of environmental group that follows the goings on at the state capitol (that would be our friends at the Iowa Environmental Council) but the success of our watershed projects is very much affected by state and federal policy.  A big part of our work is environmental education, but often “is a river still polluted and what can we do about it” is a legal and political question as much as a scientific question.  I hope this tricky case study from the Cedar River will illustrate why we need more people to learn about and talk about environmental policy to make it more transparent, fair, and effective.

My New Year’s resolution for 2023 is to write fewer long articles like this one and more bite-sized lessons.  For the 50th anniversary of the Clean Water Act, we’ll be sharing 50 short facts (one a week) on social media about that important and complicated law.  Here are the first five:

1) The Clean Water Act (CWA) is 50 years old but it still has a big influence on how we evaluate and protect water quality in rivers and lakes.

2) The Clean Water Act is a federal law but is implemented at the state level, with oversight from the Environmental Protection Agency (EPA). In Iowa, the Department of Natural Resources (DNR) is responsible for issuing permits, setting standards, and assessing the condition of rivers and lakes.

3) The Clean Water Act requires public notice and public comment for many decisions. Staff at environmental agencies read and take seriously public comments, so it’s worth speaking up and having your voice heard.

4) The Clean Water Act also gives concerned citizens the standing to file suit if there is an ongoing violation that hasn’t been enforced, or if the Environmental Protection Agency is not fulfilling its mandatory duties.

5) Decisions by courts and federal agencies can come into conflict with state legislatures, which control the budgets for state agencies. For example, in Iowa there are over 700 river segments and lakes on the waiting list for a cleanup plan, because Department for Natural Resources doesn’t have enough staff to keep up with it.

We can sum that up with the old saying: “You can lead a horse to water, but you can’t make it drink.” 

In November, the Iowa Department of Natural Resources (DNR) made the unusual decision to withdraw a cleanup plan (or TMDL) for nitrate in a part of the Cedar River that supplies drinking water to Cedar Rapids.  Click here for the original plan, here for the public notice of its withdrawal, and here for the Iowa Environmental Council’s response, which provides some valuable context.  TMDL stands for “Total Maximum Daily Load.”  TMDLs are pollution budgets that explain where pollution is coming from and how much needs to be reduced in order to protect fisheries, drinking water, or recreation in an impaired river or lake.  They are often used to set permit conditions for upstream sewage treatment plants and industrial facilities.


leading a horse to polluted water in the the Cedar River

There is a joke that TMDL stands for “Too Many D*** Lawyers.”  Most state agencies ignored the part of the Clean Water Act dealing with TMDLs until a series of lawsuits by environmental groups in the 1990s.  The Cedar River TMDL was actually written under a court order in 2006.  The TMDL estimated that only 9% of the nitrogen in the Cedar River watershed was coming from regulated point sources of pollution like sewage treatment plants and factories.  Most of the reductions would need to come from agriculture, through voluntary conservation programs.  Still, the plan called for capping the pollution from point sources at the 2006 amount and not adding any more.  However, it seems that the DNR did not follow the TMDL when writing permits over the next decade, and did not enforce permit violations.

One of the most surprising violations is from a drinking water treatment plant in Waverly.  I don’t think of drinking water treatment as generating pollution, and maybe that’s why it was initially overlooked.  The facility uses reverse osmosis, which gives you cleaner water on one side of the membrane and dirtier water on the other side.  The facility has been discharging wastewater with 37.7 mg/L of nitrate into the Shell Rock River (a tributary of the Cedar).  When the DNR added a permit condition that nitrate be brought down to 9.5 mg/L, the Iowa Regional Utilities Association protested, claiming that compliance would cost them $1 million.  If my math is correct, bringing the facility into compliance would avoid only 5 tons of nitrogen pollution per year.  The TMDL calls for a reduction of 9,999 tons per year.  Enforcing this permit as written does not seem like a fair or effective way to protect water quality in the river, but I suspect there would be an easy fix if the TMDL were revised.

The Clean Water Act provides two ways to set the limits in a permit.  Water quality-based effluent limits reference the pollution budget in a TMDL.  They’re only for facilities that discharge to an impaired water body.  Technology-based effluent limits are set statewide, based on the level of treatment that’s possible with widely available, not-too-expensive technologies. The Iowa Nutrient Reduction Strategy included new technology-based effluent limits for nitrate and phosphorus, affecting 157 municipal and industrial wastewater treatment systems.  They must find a way to reduce their total nitrogen by 66% and their total phosphorus by 75% or else complete a feasibility study to show it would be cost-prohibitive to do so.  Some facilities are already making the upgrades, some won’t be done until 2027.  For the largest point source in the TMDL (the Waterloo sewage treatment plant), that means a reduction of some 333 tons of nitrogen a year.

Effluent from a wastewater treatment plant entering a river.

Of course, most of the nitrate reduction goal for the watershed (9,999 tons) will need to come from agriculture.  We don’t know how that’s going because Iowa doesn’t have a current or complete tracking system.  The most recent data I could find for cover crops by watershed is 7 years old.  At that time, there were not enough acres to make a noticeable difference in water quality in the river.

Cover crops in the Cedar River watershed
Cedar River watershed map, courtesy of IIHR

Side note: The Cedar River starts in Minnesota and has several major tributaries, including the Shell Rock River, West Fork, and Winnebago.  It’s a big watershed that usually gets divided into smaller chunks (i.e. there are separate watershed management authorities for the Upper, Middle, and Lower Cedar).  The TMDL actually recommended prioritizing conservation in the Upper Cedar, but at some point, the focus got shifted to the Middle Cedar.

Are water quality based-effluent limits still needed?  Maybe not, but the frustrating thing about this case is that we get don’t get a revised pollution budget that shows how other strategies will protect drinking water in Cedar Rapids.  We don’t get a public debate over what’s not working with this law and an opportunity to change it.  Instead, we get excuses for why a revised TMDL can’t be done and isn’t needed.  Some of those excuses are legitimate: the chronically underfunded DNR has a lot of TMDLs to write and not enough staff to do it.  Some of the excuses are flimsy: apparently, the document mishandled nitrogen units in a way that was too subtle for me to notice on the first read-through but serious enough to make the whole thing unworkable.

Another excuse—that the Cedar River is no longer impaired—seemed like a mistake at first but turned out to be technically correct on closer inspection.  “No longer impaired” means that fewer than 10% of the samples collected during the last two assessment periods (2016-2018 and 2018-2020) exceeded the drinking water standard.  I’ve double-checked this with another source of data and think this assessment holds up, even if we account for weather.  It’s just premature.  Nitrate was back up in 2022.

nitrate violations in the Cedar River

Well, you know what they say.  You can lead a state agency to water, but they can’t make it drinkable.

(Apologies to my respected colleagues at DNR.  I can’t resist a good pun!)

TMI stands for “Watershed Plan”

TMI stands for “Watershed Plan”

I missed the deadline for public comment on the new watershed plan for the Headwaters of the South Skunk River.  We were given only two weeks and it’s a 200-page document.  I can either respond with a quick text message: “TMI” (Too Much Information) or with a careful read and 700-word article.  Since the deadline is passed, these comments are really meant for our readers who might be wondering what’s in the plan and what it will mean for the river.

An imaginary text message conversation about the watershed plan

Watershed Management Authorities (WMAs) are authorities in name only, with no taxing or regulatory authority, and given no direct funding from the state.  Quarterly WMA meetings are a good forum for sharing news about water-related projects and opportunities, but some WMAs go years without managing a budget or holding a vote. Skimming the plan gives me hope that the Headwaters of the South Skunk River WMA could be more productive.

Roles of stakeholders in watershed, as shown in a handout for the open house.

One of the most illuminating parts of the plan is this piece, which explains the role of a Watershed Management Authority, its member jurisdictions, and some of its partners.  Chapter 7 fleshes out what needs to be done and who’s responsible.  Chapter 8 fleshes out where they could get the money to do it.  Put together, it’s a road map for getting some conservation practices on the ground, and cleaning up the water. 

The report includes a lot of good technical information about pollution and solutions. I especially like Chapter 5, with its emphasis on practices that can address both nutrient reduction and other issues like habitat and flooding.  There are some new ACPF maps for Hamilton County that will be very helpful for working with farmers to find suitable places for bioreactors, wetlands, and other structural practices.  There’s an eye-opening section on absentee-owned farmland (section 2.03) and why it might not be as big a barrier to conservation as people think it is.

But like most watershed plans, the emphasis is on all the tasks that were completed and all the information that was compiled, rather than what was learned and why it’s important.  This style of technical writing has two negative consequences:

table of invasive species

First, it makes it hard for a casual reader to tell the difference between what we know and what we don’t know. Here’s a table that looks like a list of invasive species in the watershed, but is actually a list of invasive species in the state, that may or may not be found in this river system.  Then there’s a table of streams with designated uses, but it doesn’t actually tell us which ones can support fishing or swimming.  Most of the smaller streams are only presumed to be swimmable, and if the DNR gets around to checking (through a field study called a Use Attainability Assessment), the rebuttable presumption would likely be rebutted.  I have spent many hours dealing with the confusion resulting from this little caveat: see Chapter 2 of the Story County Water Monitoring Plan.

Skimming through page after page of maps and tables gives the impression that the watershed has been exhaustively researched, but some of the main recommendations of the plan are for additional assessments that wouldn’t fit in the budget.

  • We know that normal farming practices can leak nitrogen and phosphorus, but we don’t know which areas are leakier than average, to be able to prioritize conservation practices where they can do the most good. The plan recommends additional monitoring in Hamilton County and the construction of a computer model.
  • We don’t know much about flood risks and mitigation opportunities in the watershed. The plan recommends commissioning a hydrologic assessment.
existing conditions poster from open house

Second, it reinforces a very human tendency to see what we expect to see.  If you expect to see high nitrogen levels in the South Skunk River, you have to look very carefully at the graph to realize that no, nitrate was actually quite low the last two years (a median of 3.1 mg/L) because of the drought.  I didn’t notice it until my third look at the poster above.  If the report is full of maps and tables that don’t seem important, or that tell you things you already know* then you stop looking carefully.  And that’s how you end up setting a target that would require an 80% reduction in nitrate, relative to the long-term average (8.8 mg/L).  Fortunately, I caught this during the public comment period, and authors are fixing it for the final draft.  I mention this not to criticize anyone, but to illustrate why it’s important (and not easy) to connect the dots between data, their implications, and action.

* A lot of the inventory chapter reads like “Figure 1 – Central Iowa is flat, Figure 2 – Central Iowa has a lot of corn and soybean fields, Figure 3 – The fields have drainage tiles, Figure 4 – Central Iowa raises a lot of hogs.”

I hope that Prairie Rivers of Iowa can work with the new Watershed Management Authority to help connect those dots, and help to implement the recommendations in what I think is a solid plan.

South Skunk River after the first snows of November.