Iowa has a lot of hogs, poultry and cattle raised in concentrated animal feeding operations (CAFOs). They produce a lot of manure. However, CAFOs are not evenly distributed across the state, and it’s rarely practical to haul the manure long distances. Do rivers with more CAFOs in the watershed have worse water quality? I was curious and recently completed a big data analysis project to find out. I’ve omitted some of the technical details in the interests of making this article easier to read, but hope to eventually submit this research to a scientific journal for peer review. Get ready for a nuanced, data-driven look at the elephant in the room!
Livestock Density by Watershed
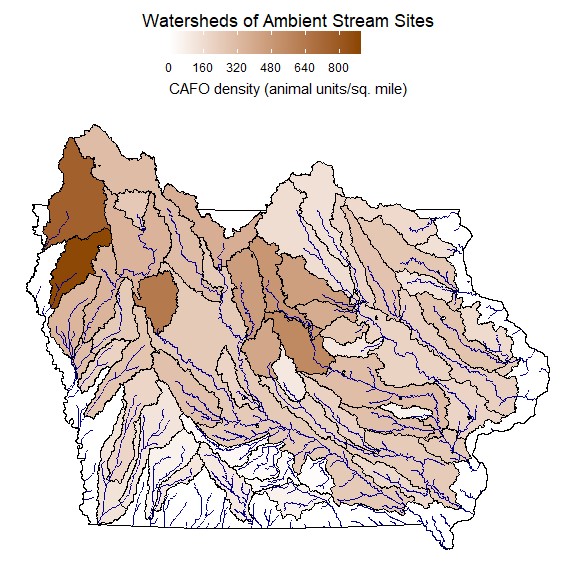
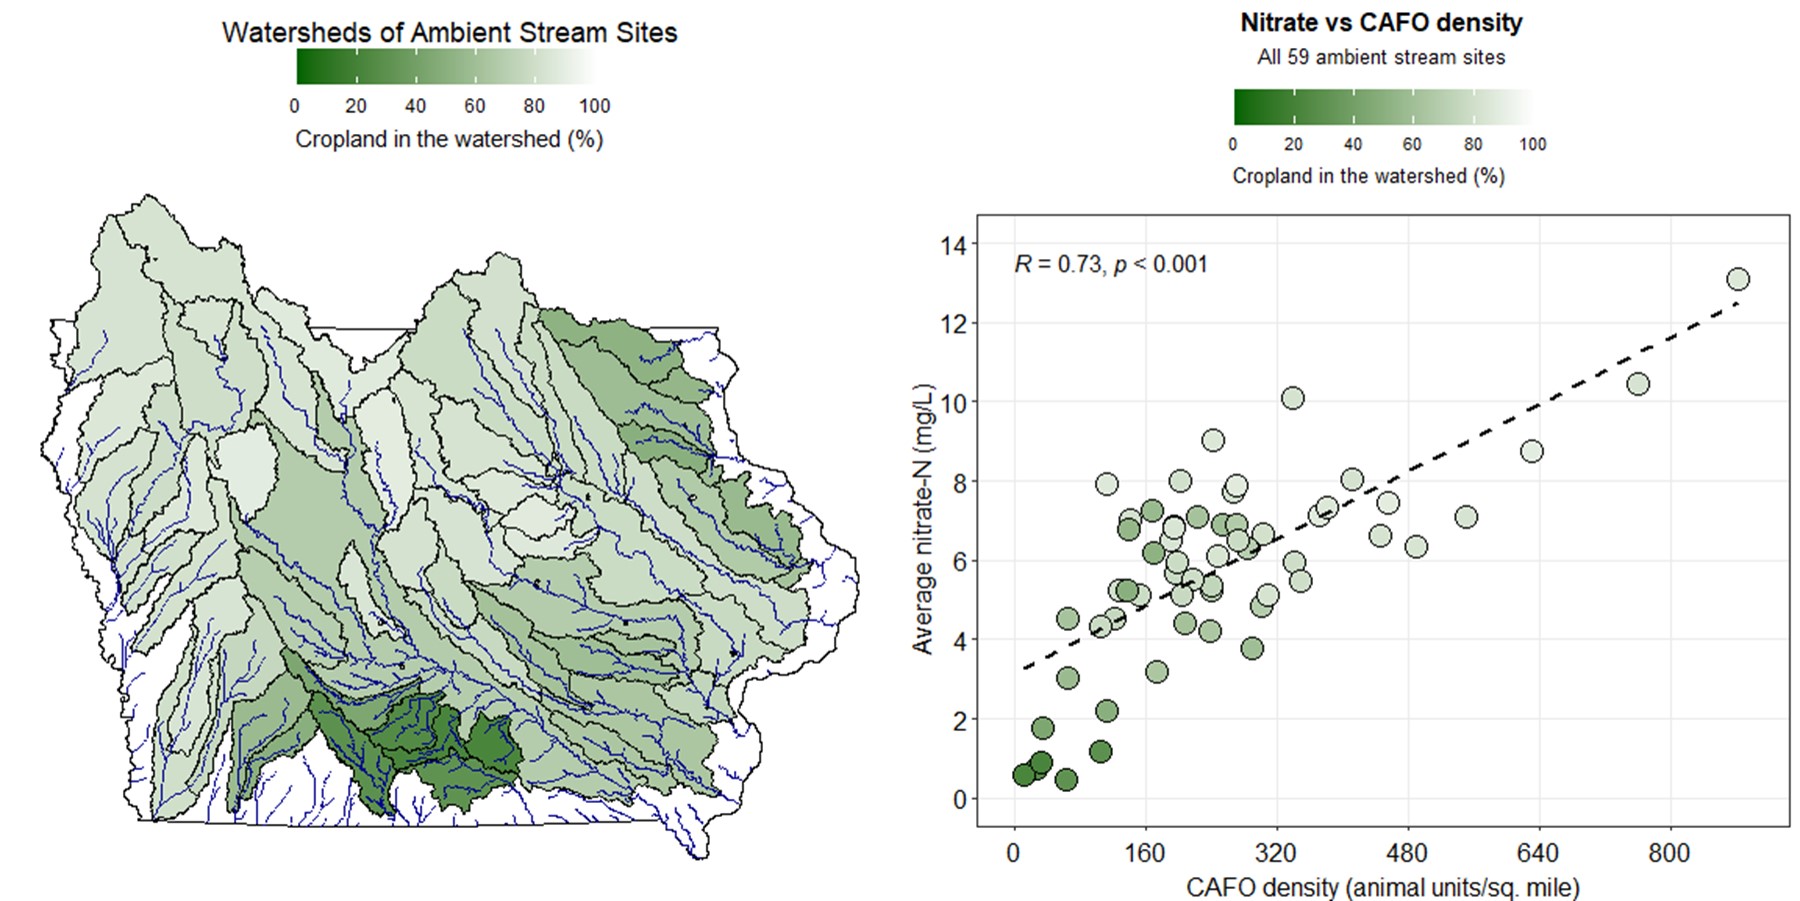
The water quality data for this study comes from 60 sites in Iowa DNR’s ambient stream monitoring network. (Two sites were later dropped because of incomplete data). For each monitoring site, I delineated a watershed (the land draining to that point) and overlaid databases of animal feeding operations. CAFO density in these watersheds varies greatly: from 12 animal units per square mile in Cedar Creek near Bussey, to 883 animal units per square mile in the Floyd River near Sioux City.
Animal units are a way of standardizing herd size across ages and species. For regulatory purposes, one 1000 pound steer is equivalent to 10 pigs under 55 pounds, 2.5 pigs over 55 pounds, 55 turkeys, or 82 layer hens. Feedlots with at least 300 animal units are tracked in Iowa’s database. Feedlots with 500 animal units require a manure management plan, and feedlots with 1000 animal units require a construction permit. The Iowa Environmental Council continues to follow and raise concerns about these rules.
Initial Findings and Complications
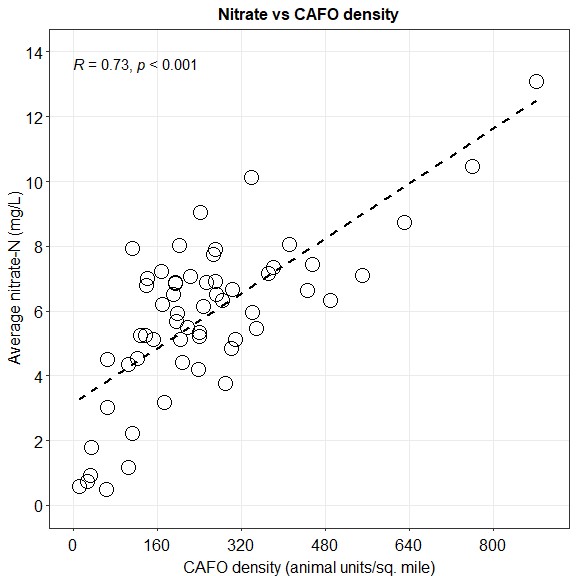
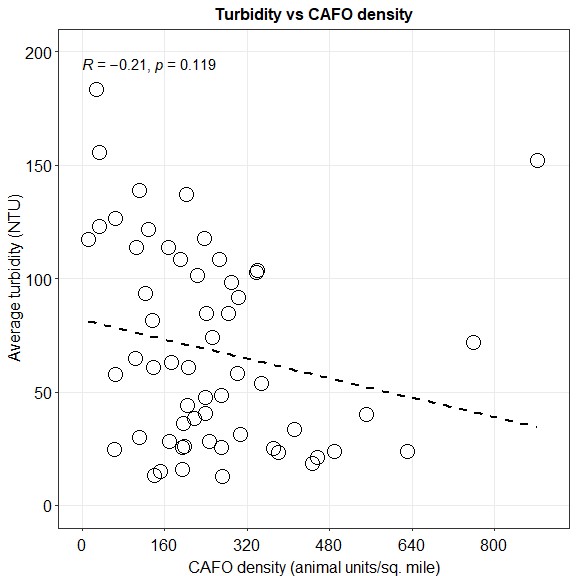
In the article that inspired this project, “The Fair, the Marginal, and the Ugly”, Chris Jones used this same dataset to rank water quality in Iowa’s rivers and noted that the river with the worst water quality has the most CAFOs. The Floyd River had the highest nitrogen and total phosphorus, the third highest turbidity, and the sixth worst E. coli. Sticking with the same time period (2016-2020) and similar metrics, I plotted water quality against livestock density for 58 sites to see if the Floyd River is part of a larger pattern. For nitrate, yes; for total phosphorus, maybe; for turbidity and E. coli, no. The relationship with turbidity is weakly negative; rivers with muddier water actually tend to have fewer CAFOs in the watershed.
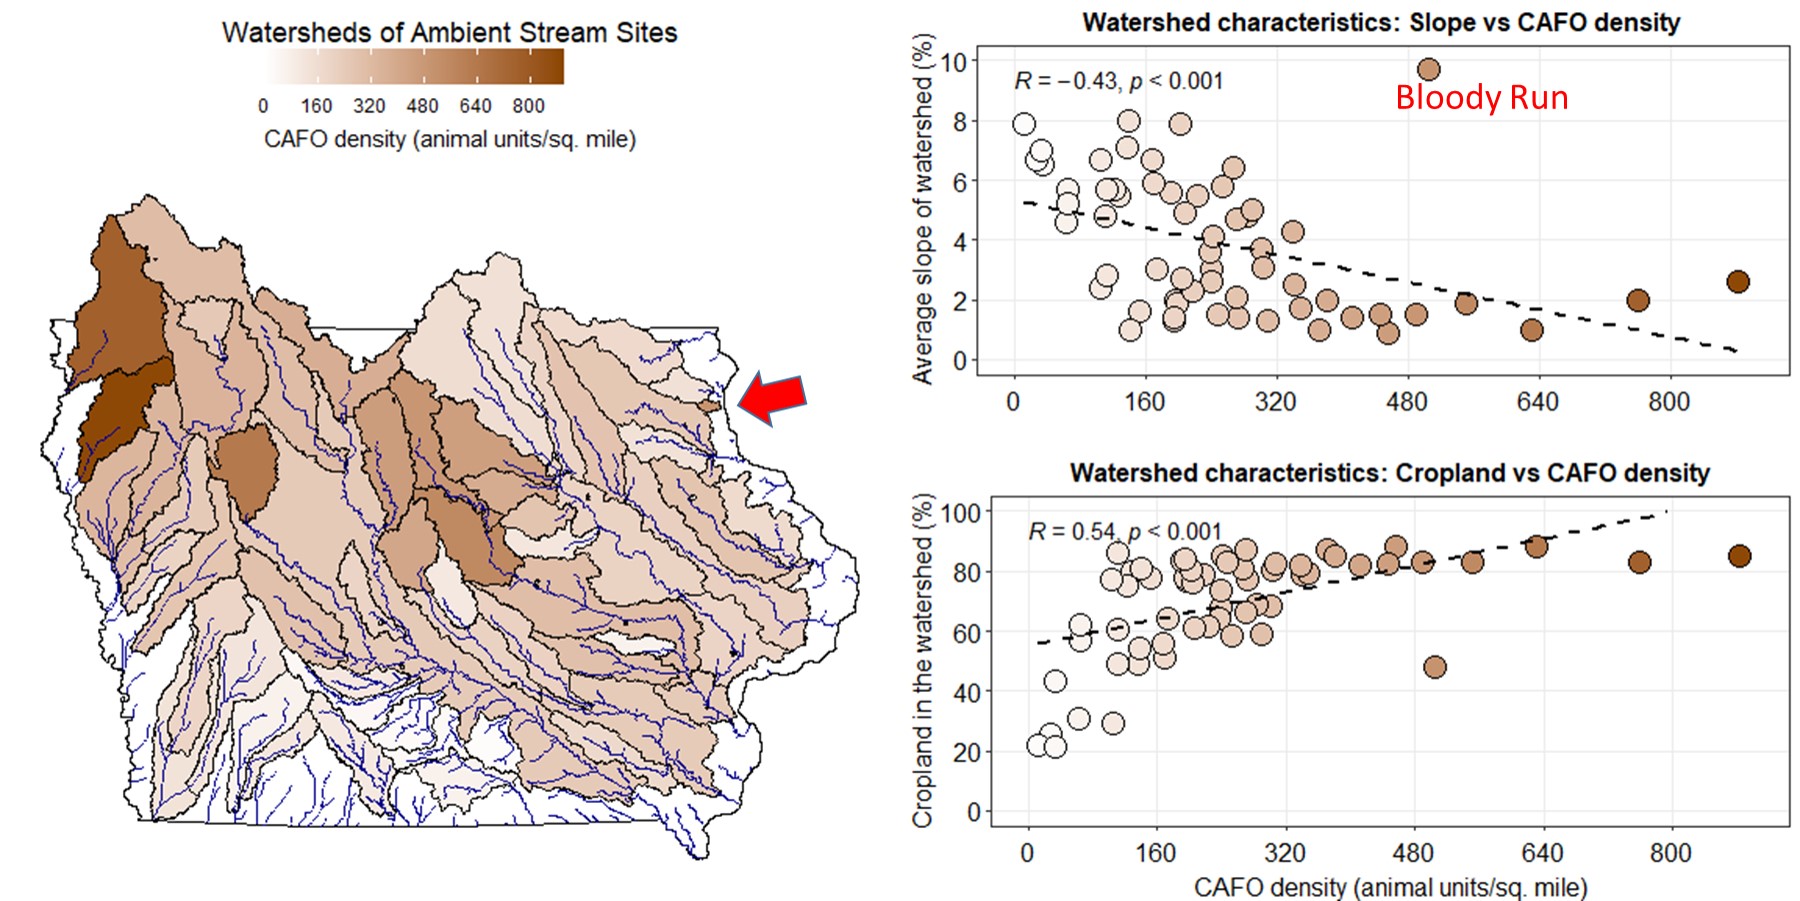
The best explanation for this is that there is a third factor influencing both water quality and CAFO density: terrain. CAFOs are most common in flatter parts of the state where construction permits are more likely to be approved and there is plenty of cropland nearby to spread the manure. The notable exception to the pattern is Bloody Run, a trout stream in northeastern Iowa. In 2021, the Iowa DNR approved the construction of a 11,600 head cattle feedlot in this watershed, despite the steep terrain and abundant sinkholes. Given the timing, I am excluding this site from analysis and hope we do not have to find out what happens to water quality when this much manure is added to an environmentally sensitive area.
Primary drivers of water quality
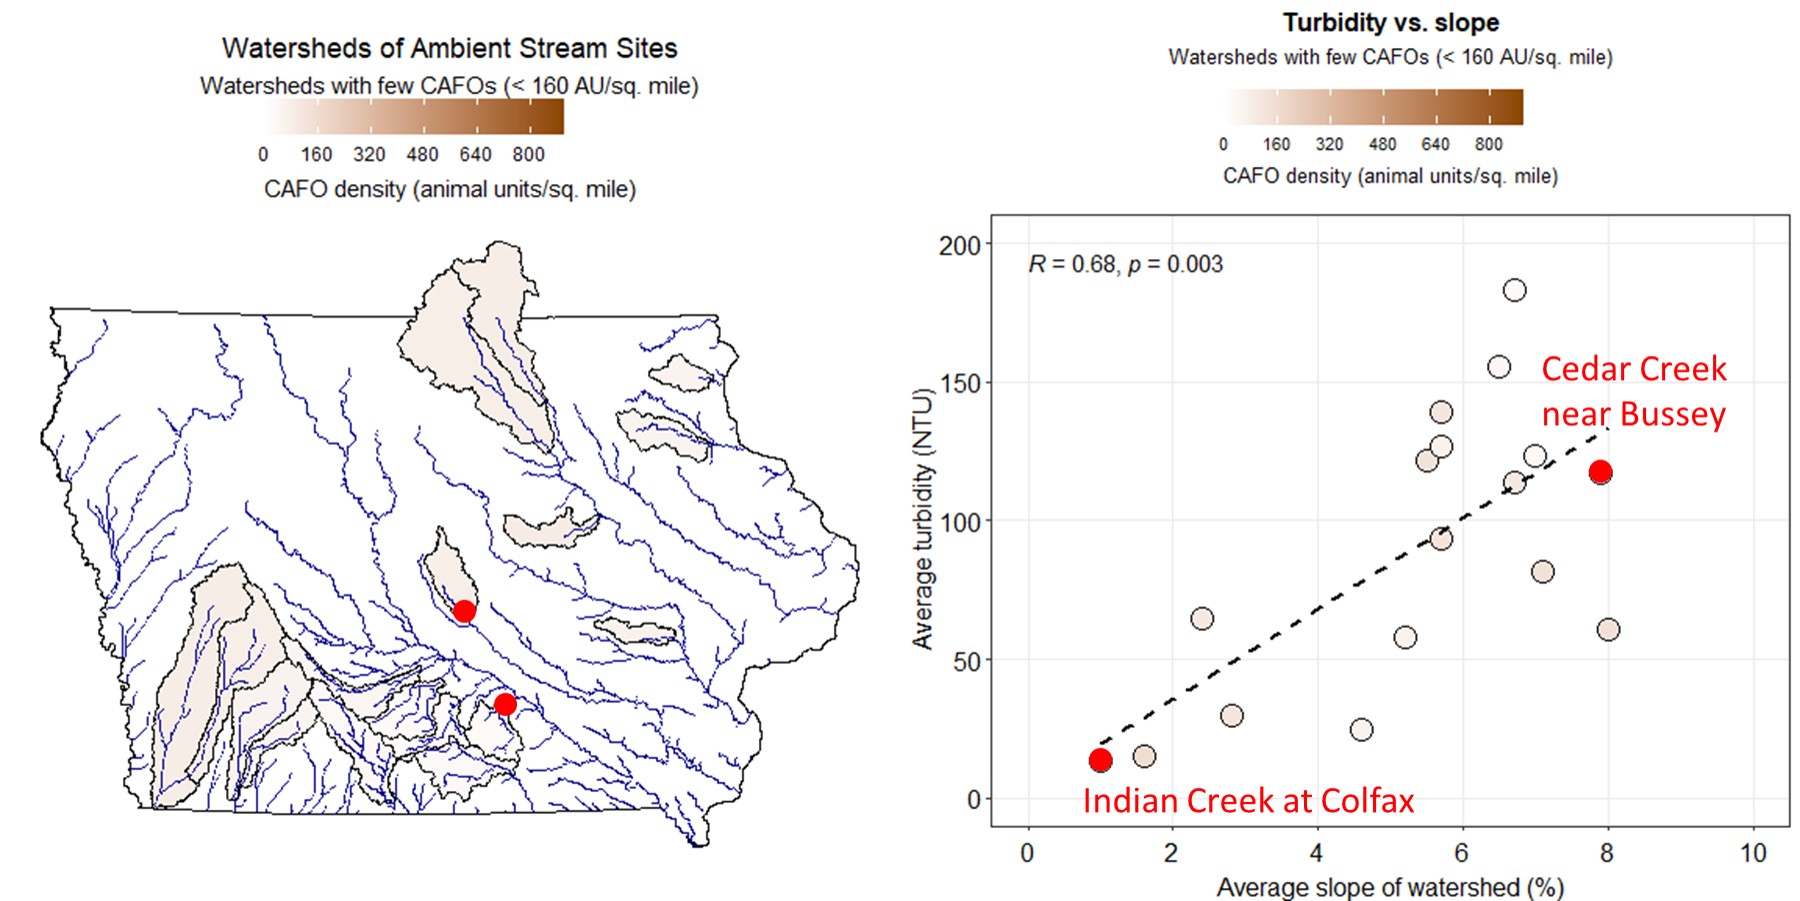
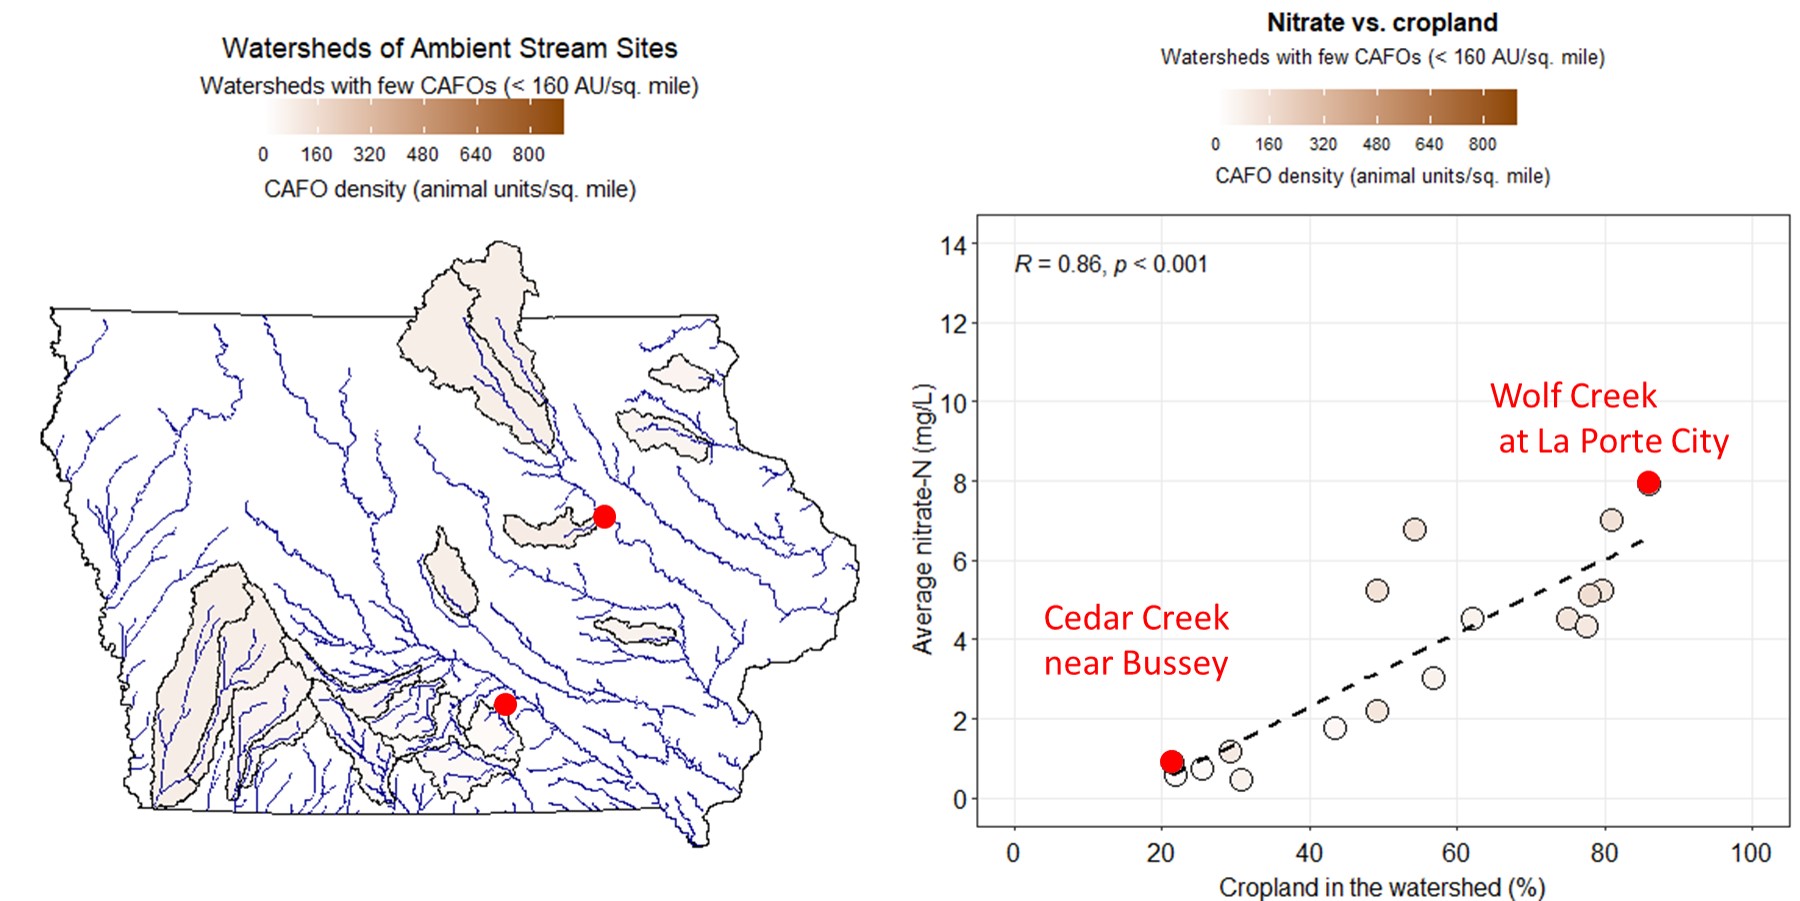
To better understand the interactions of multiple variables without a lot of statistics, I like to color-code one of them (in this case, CAFO density) and then focus on a narrow range (in this case, watersheds with less than 160 animal units/square mile). You’ll see this technique several times in this article. This shows how slope and cropland in the watershed influence water quality, independent of CAFOs.
Slope: As you’d expect, turbidity in rivers is strongly correlated with the average slope of land in the watershed. Steep hills are more susceptible to runoff and erosion. Phosphorus and E. coli are also attached to sediment and carried by runoff, so are moderately correlated with turbidity, and weakly correlated with slope.
Cropland: Nitrate in rivers is strongly correlated with corn and soybean acres in the watershed. Long-term nitrate trends can also be explained by changes in cropping patterns (a replacement of hay and small grains with corn and soybeans). I’ve heard corn and soybeans described as a leaky system, and want to echo that. Whether the nitrogen comes from manure, ammonia, or soil organic matter, if you don’t have something green and growing in the early spring, you’re going to lose a lot of it.
Manure and Bacteria in the Water
E. coli is a bacteria found in the guts of birds and mammals, an easy-to-measure proxy for poop in the water and the pathogens that might come with it. For many environmentalists, the reason for Iowa’s long list of impaired waters seems frustratingly obvious. Hogs, poultry, and cattle outnumber humans, dogs, geese, raccoons, and deer, so they must be the main source of E. coli. Here’s an example of that kind of thinking from a report by the Environmental Integrity Project.
“Iowa is America’s hog capital – and also one of the most unhealthy areas in America to swim in rivers and streams. That’s in part because of the vast amounts of hog waste and farm runoff polluting the state’s waterways.”
The same logic showed up in the watershed management plan for Ioway Creek (and some others like it), which assessed likely bacteria sources based on the population of various kinds of animals and the amount of manure they excrete per day. While the consultants were careful not to say that hog confinements in Hamilton County were the main reason for chronically high E. coli in the creek, I sure got that impression from reading the maps and tables.
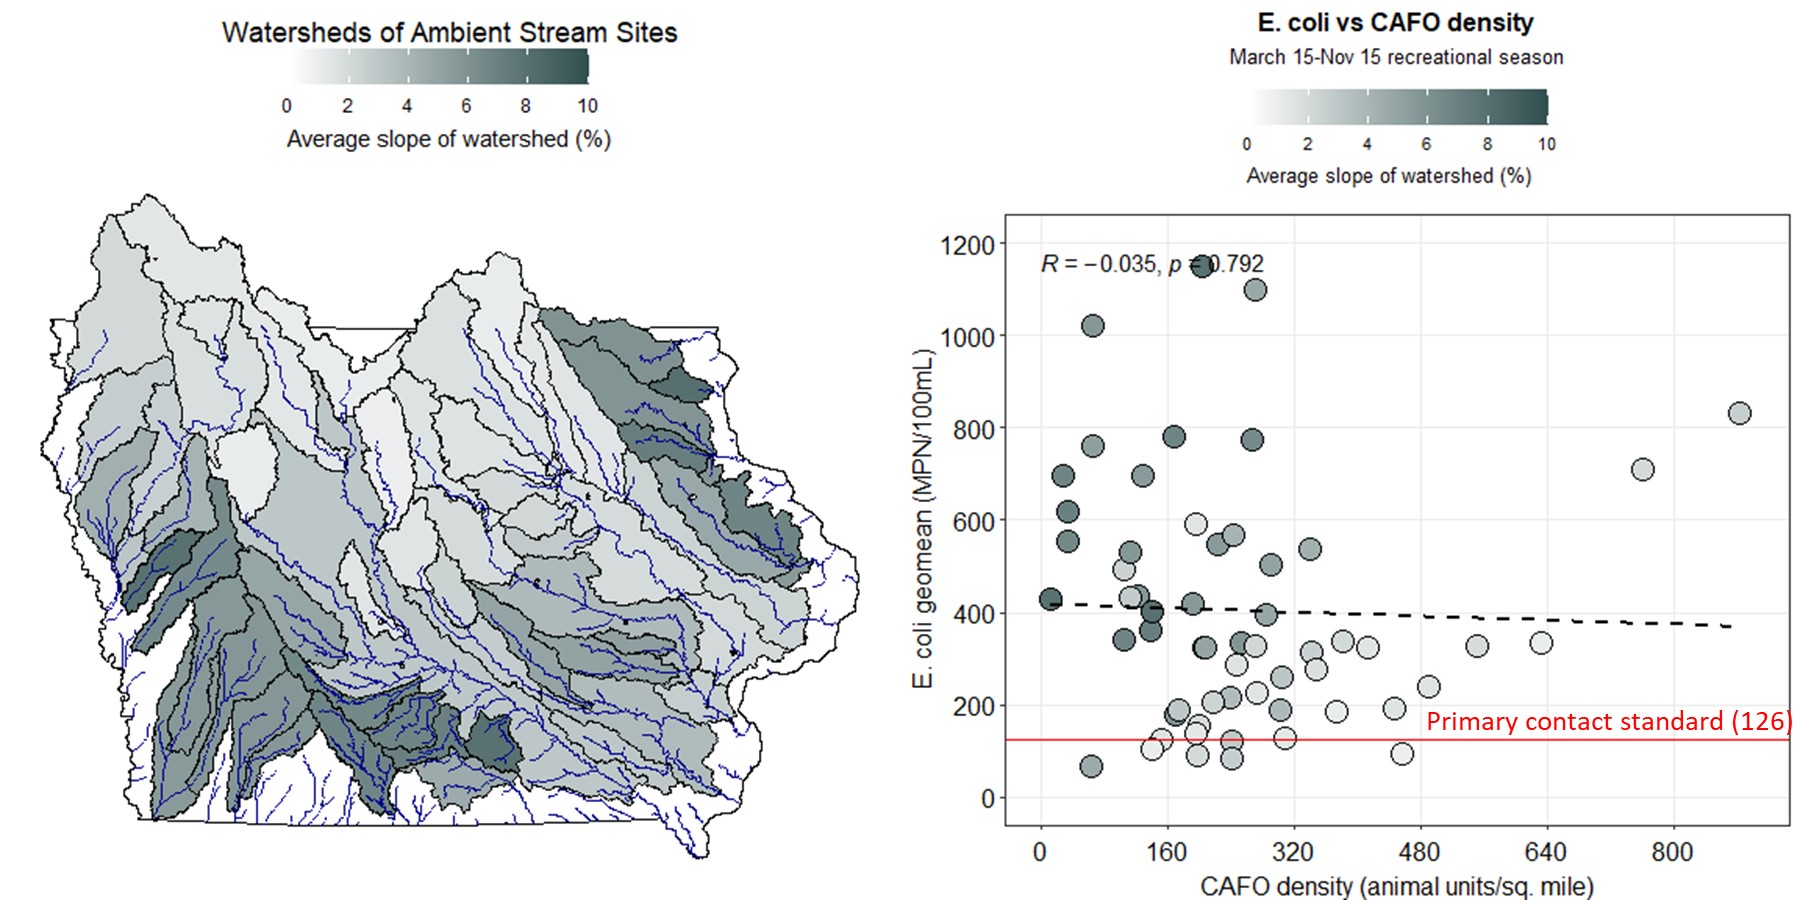
Looking at livestock populations turns out to be an unreliable way to guess which rivers will have bacterial impairments. Statewide, there is no correlation between E. coli in the river and livestock density in the watershed. The three worst rivers for E. coli in this dataset (the Soldier River near Pisgah, Maquoketa River near Maquoketa, and W. Nodaway River near Shambaugh) have less than 320 animal units per square mile, on the low side for Iowa.
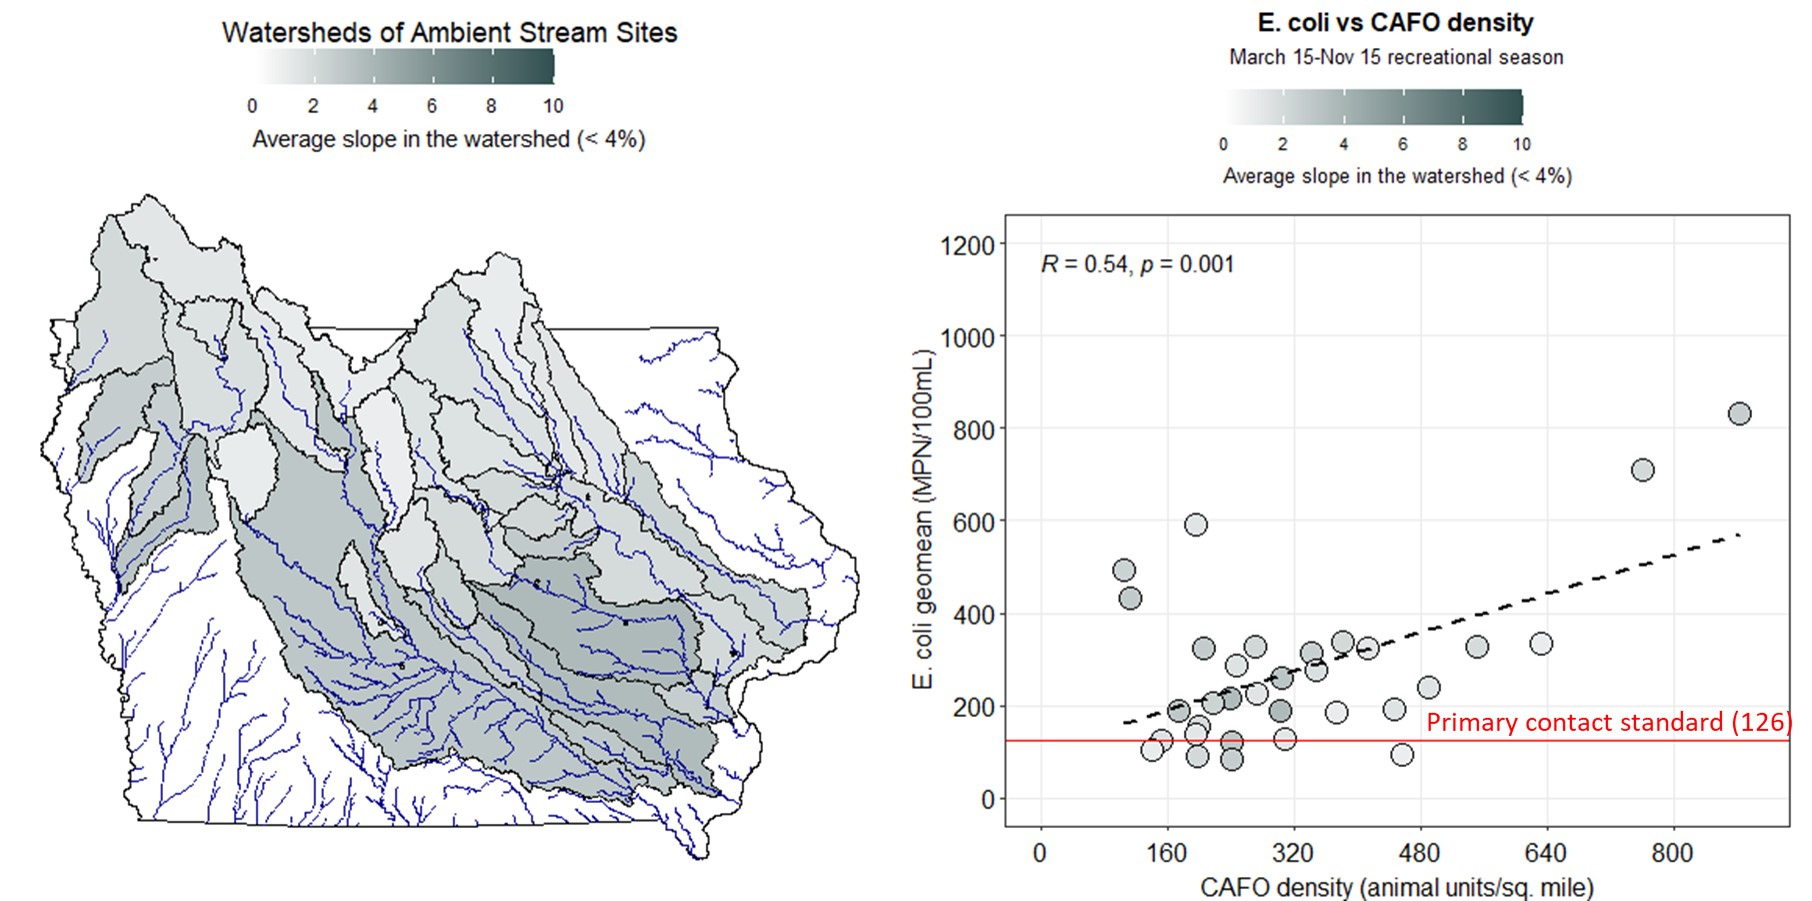
More sophisticated models take into account the fraction of manure that reaches streams, how long it takes to get there, and how much of the bacteria dies off in the meantime. Unsewered communities, geese on the beach, raccoons in the storm sewer, and cows wading in the creek produce much less manure than animals in CAFOs, but a larger fraction of the manure is delivered directly to the water when it’s still fresh. That’s not to say that manure from CAFOs have no influence on E. coli in rivers. Once rivers with slopes steeper than 4% were excluded, the remaining sites had a moderate correlation between E. coli and livestock density.
Manure Nutrients in the Water
If manure is applied to fields that are not too steep and set back from streams, during appropriate weather conditions, and especially if the manure is knifed into the soil, very little of the solids, E. coli bacteria and pathogens in the manure should reach streams. The same is not true of the nutrients in the manure. Nutrients cycle between different forms, and the more readily dissolved forms (nitrate and orthophosphate) can easily leak out of the root zone during periods when crops aren’t growing, and make their way to streams.
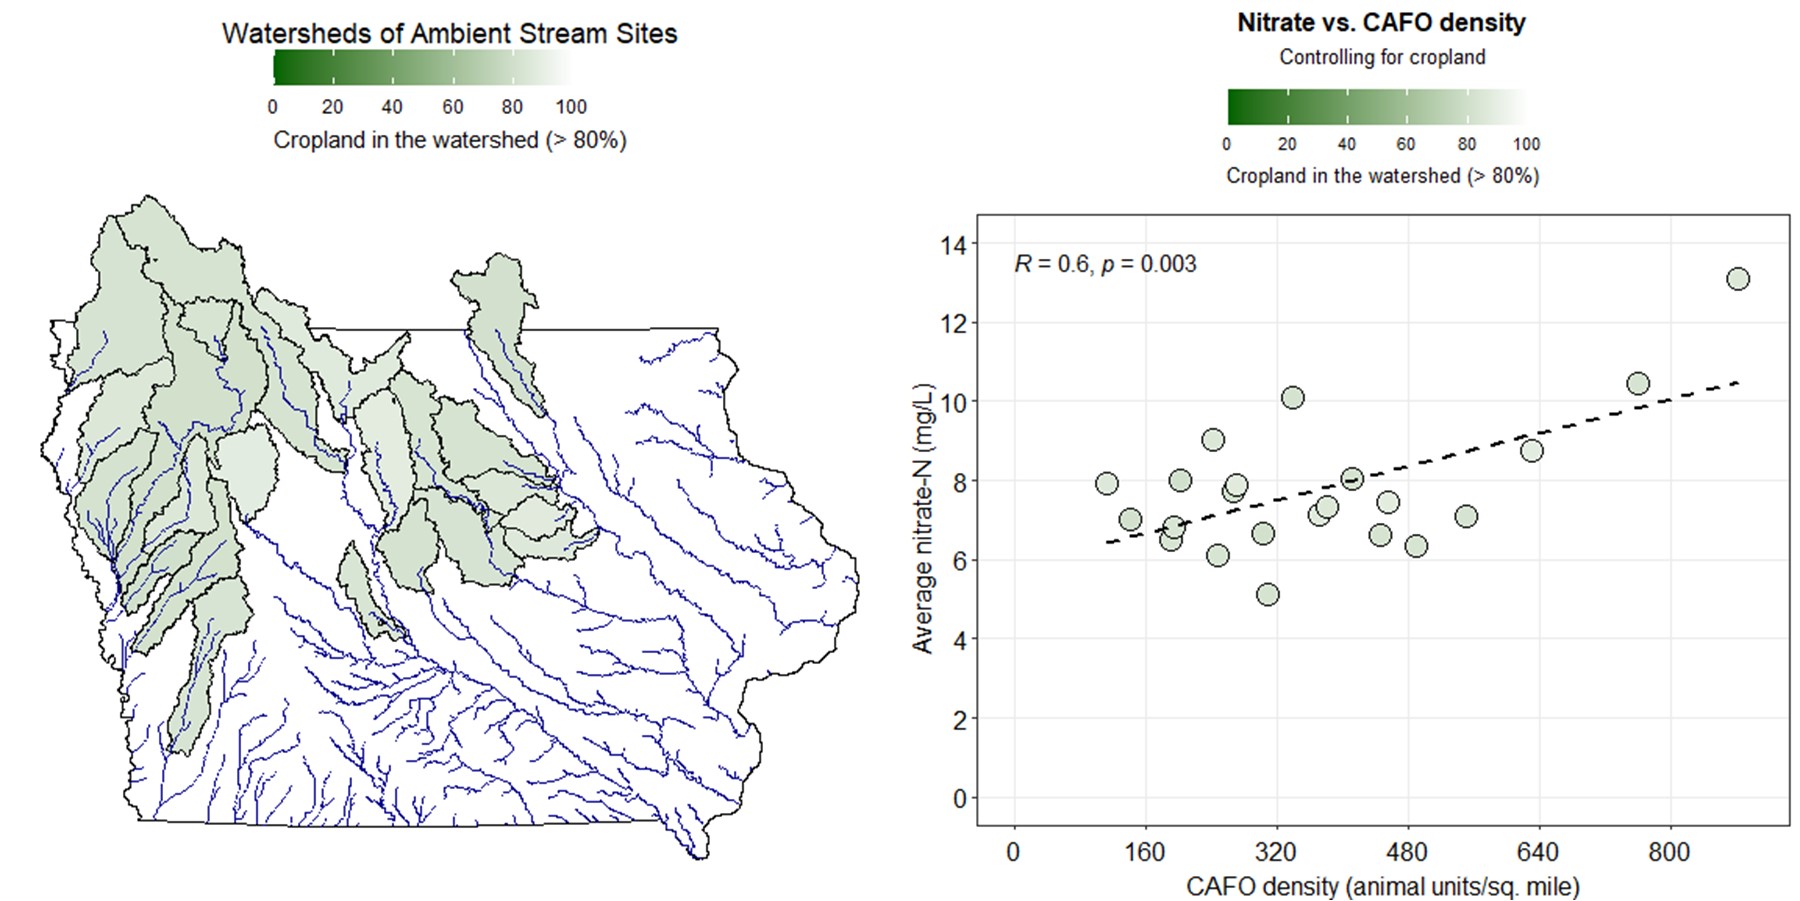
Watersheds with a high density of CAFOs tend to have much higher nitrate concentrations, but most of that is because those watersheds also have a large proportion of the land in row crops. However, focusing on sites with at least 80% of the watershed in row crop production, there is still a positive correlation between livestock density and both nitrate and total phosphorus.
In the science assessment for the Iowa Nutrient Reduction Strategy, manure was not treated as a challenge for nutrient reduction, it was treated as a best management practice. It makes a certain amount of sense: manure is a slow-release fertilizer that adds organic matter to the soil. Compared to plots fertilized with commercial fertilizer, plots fertilized with swine manure had 4% less nitrate loss by 46% less phosphorus loss, mainly due to soil improvements that reduced the amount of runoff. However, those agronomic trials must have used a different set of application rates than usually occurs in practice. If you look at both commercial fertilizer sales and manure availability, counties with many CAFOs apply nitrogen and phosphorus at higher rates, with consequences for water quality. Here’s one study from Minnesota and another from Iowa that document this.
Closing thoughts
Prairie Rivers of Iowa has worked with some large swine and cattle producers who were early adopters of cover crops and who are very careful about how they manage manure. We salute their efforts to improve soil health and protect water quality. A study like this can only address the impacts of the industry as a whole.
This project was funded in part by a research grant from the Raccoon River Watershed Association, which has been monitoring water quality in Greene County. Last summer, the group watched with alarm as hog manure leaking from an earthen storage basin turned the water in a creek brown and caused the dissolved oxygen in the water to drop to zero. These kinds of incidents happen way too often, but usually affect a small stretch of stream for a short period of time, so don’t show up in monthly water quality datasets.
The correlations between water quality and livestock density disappeared entirely when I looked at two drought years (2021-2022). During dry periods, runoff and tile drainage from farmland is minimal, but effluent from sewage treatment plants and industry (including meatpacking plants) can have a bigger influence on water quality. Manure from CAFOs definitely impacts water quality in Iowa, but if we’re too quick to blame them in every situation, we may miss what’s really going on.


