There is poop in Iowa’s lakes and rivers! I’m sure you know this by now. The Iowa DNR monitors bacteria at 39 beaches every week during the summer and posts a “swimming not recommended” sign if the average for the month exceeds 126 E. coli/100mL. If a lake has a history of problems, another threshold (235 E. coli/100mL in a single sample) is used as an early warning system. As Iowa Environmental Council has reported, Iowa DNR issued 134 of these beach advisories last summer. Streams are monitored less often, but we can use the same thresholds to evaluate average conditions at the end of the season. Last year, all 15 streams that we monitor in Story County had E. coli levels above the primary contact recreation standard.
Story County Conservation posted a warning sign at the Tedesco Environmental Learning Corridor.
Okay, but what do we do with that information?!
I know some people who are so grossed out they won’t dip their toes in any lake or river in Iowa, even if the DNR says it’s okay. I know some other people who went ahead with a canoe trip on the Des Moines River, despite reports that just two days before, a broken sewer main in Fort Dodge had released 400,000 gallons of raw sewage into the river upstream of their route. They’ve paddled polluted waters before and figured it was no worse than usual.
Part of the difficulty is that some people translate “an unacceptably high number of beach advisories” to “lots of poop in the water everywhere all the time.” That’s not what’s happening. If you picked a summer weekend and a state park at random, and took your family to the beach, you would have had a 77% chance of swimming in water that met the primary contact recreation standard. If you subscribe to IEC’s Water Watch newsletter, you can make sure you pick the right one!
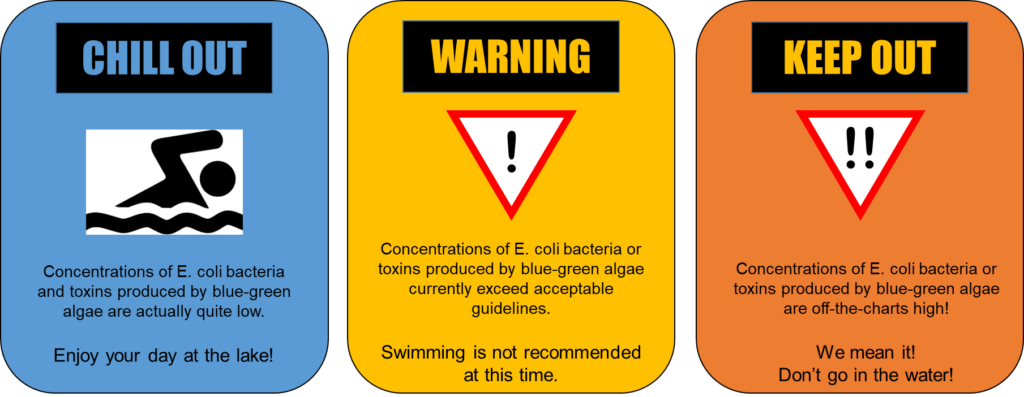
Part of the difficulty is that Iowa relies heavily on just one threshold to issue alerts and place waters on the Impaired List. Some other states have started used a red/yellow/green warning system that distinguishes between “swimming not recommended” at 235 E. coli/100mL and “beach closed” at 1000 E. coli/100mL. This is helpful if you’re a little more tolerant of risk or are doing activities that will keep your head above water. That upper limit is the same as the one used during the 2024 Summer Olympics to determine whether to hold swimming events in the River Seine.
Seine River in Paris, photo credit Erik Larson
You may recall that Paris spent $1.5 billion to clean up the Seine River in time for the 2024 Summer Olympics and still had to postpone some events because of poor water quality. Similarly, Story County Conservation has spent $3.4 million to restore Hickory Grove Lake and still had to post beach advisories four weeks last summer. There is no easy fix for these problems. However, a long-term perspective on water quality in the Seine shows how an open sewer can become a swimmable river (at least most of the time) with improvements in wastewater treatment. Yes, Iowa has more livestock than people, but I’ve been seeing some evidence that points to humans as the main source of feces and pathogens in many of Iowa’s waterways. If that’s true, then our water quality could benefit from projects to replace combined sewer systems (we still have a few), add liners to rusty sanitary sewers, get septic systems up to code, and make some overdue upgrades to sewage treatment plants.
Randy Evans was on the right track when he compared water quality in Iowa to water quality in Paris, but he only looked at one day. I’ve gone a few steps further. In the attached table, I’ve shown the best, worst, and average E. coli readings measured last year at some of Iowa’s most popular beaches and water trails. Below, I’ve put them in broad categories, benchmarked to some examples from France. I’ve also included some sites we monitor in Story County, in bold. Get ready to calibrate your disgust!
How do we measure poop in the water?
Escherichia coli is a species of bacteria found in the guts of birds and mammals. Some strains are harmless and some can put you in the hospital. It’s an easy-to-measure proxy for feces in the water, which could carry a wide variety of disease-causing microbes. E. coli can be measured directly by counting dots in a Petri dish (Colony Forming Units, CFU/100mL) or indirectly using a chemical reaction (Most Probable Number, MPN/100mL) but the results are similar enough that these units are often used interchangeably.
Typical laboratory protocols have a lower detection limit of 10 and an upper quantification limit around 24,000. With such a big range, E. coli data has to be plotted on a log scale and averages have to be expressed as a geometric mean or median—basically, worry less about the exact number and more about the number of digits.
1 digit: As clean as it gets without chlorine
Too low to detect, with typical methods (reported as <10)
A typical beach day at Peterson Park
A typical beach day at Lake Rathbun, Gray’s Lake, or Lake Okoboji
A good day at most lakes on the impaired list
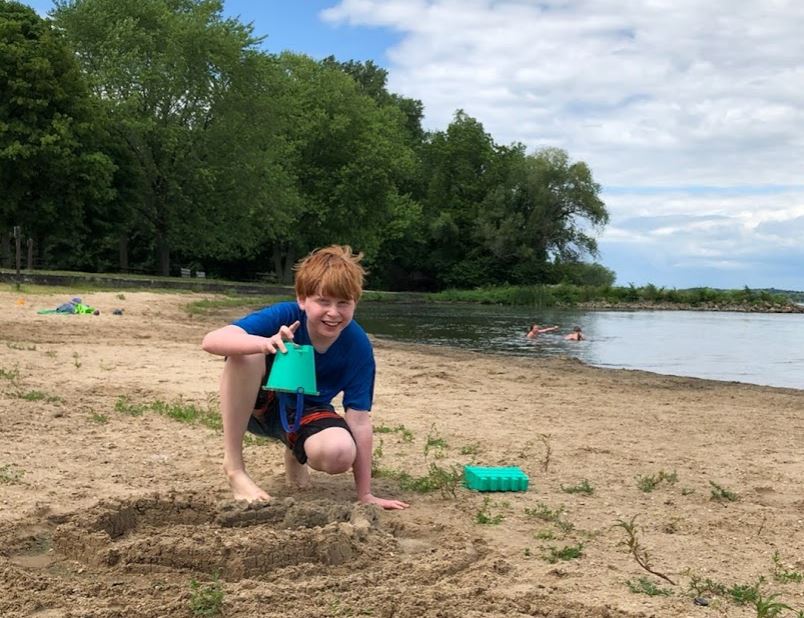
Peterson Park Beach. A favorite spot for my family during COVID lockdown and consistently clean.
2 digits: Have fun in the water!
Meets Iowa’s primary contact recreation standard (geomean <=126, single sample <=235)
A typical day at a French stream running through forest or cropland
Treated effluent from Iowa sewage treatment plants with UV disinfection
A typical beach day at Hickory Grove Lake
A typical beach day at Lake MacBride (Iowa City) or Big Creek
A bad beach day at Peterson Park
A bad beach day at Lake Okoboji
A typical day at the Charles City or Manchester whitewater parks
A good day at most rivers on the impaired waters list
Kayaker at Manchester whitewater park. I tipped and swallowed water when I attempted it, but it was probably fine.
Low 3 digits: Swim at your own risk (families)
May exceed IA primary contact recreation standard (geomean >126, single sample >235)
A typical day at a French stream running through pasture
The Seine River in Paris during the women’s marathon swim
A typical beach day at Clear Lake or Lake Darling
A bad beach day at Lake Rathbun
A bad day at the Charles City whitewater park
A typical day on the S. Skunk River water trail
Kids swimming at Clear Lake. No beach advisory on this day, but there had been other weeks.
High 3 digits: Swim at your own risk (athletes), canoe at your own risk (families)
May exceed Iowa’s secondary contact recreation standard (geomean > 630, single sample >2,880)
The Seine River in Paris during the men and women’s triathlon
A typical day at Ioway Creek in Ames
A typical day on the lower Maquoketa River (near Spragueville)
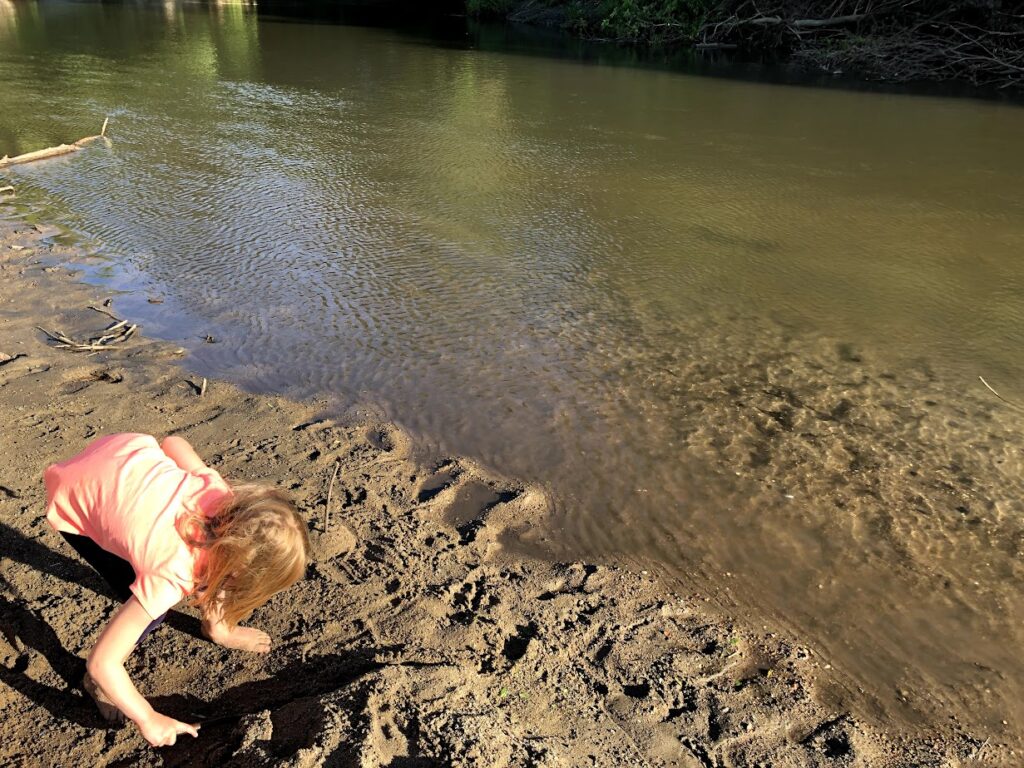
My daughter playing on a sandbar in Ioway Creek in Ames. I’m sad to say it, but I don’t think kids should be playing in this water.
4 digits: No swimming, canoe at your own risk (experienced paddlers)
Action limit for beach closures in some states (single sample > 1000)
A bad day for the Seine at the 2024 Olympics; men’s triathlon postponed
A typical day for the Seine in the early 2000s (since improved sewage treatment, but before sewer system improvements)
Treated effluent from modern Paris sewage treatment plants
A bad beach day at Gray’s Lake, Lake MacBride, Big Creek, Clear Lake, or Lake Darling
A typical day at West Indian Creek, downstream of an outdated sewage treatment plant
A bad day on the Skunk River or Ioway Creek (1.5 inch rain previous night)
A bad day at the Manchester whitewater park
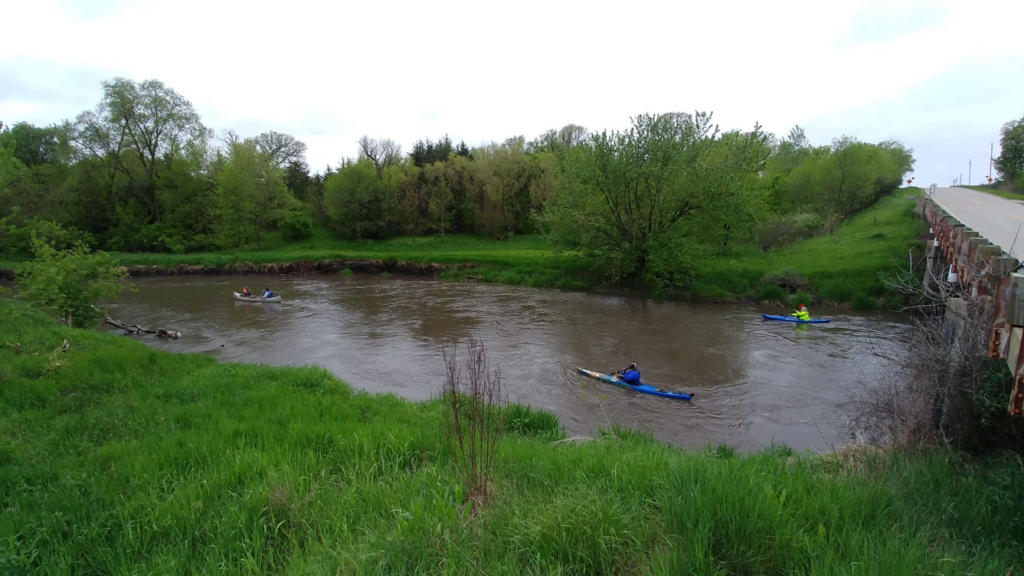
Canoe trip on Ioway Creek in Boone County. I collected a water sample at this moment. E. coli measured 2,390 CFU/100mL.
5-6 digits: Stay out of the water
May be too numerous to count, with typical methods (reported as > 24,000)
A typical day for the Seine in the 1980s, before modern sewage treatment
A bad day on the Seine River in 2008, before attempts to control combined sewer overflows
A bad day at West Indian Creek (1.5 inch rain previous night), downstream of an outdated sewage treatment plant
Flash flooding in the Skunk River or Ioway Creek (June 2022). No one should be in the water during these conditions.
Two bad days on the lower Maquoketa River (near Spragueville), during high water levels
A bad day at Hickory Grove beach. Previous studies have shown that the main source of the bacteria is geese and dogs at the beach.
The new Nevada sewage treatment plant should be operational this year and will have a UV disinfection system like this one. This should make it safer for kids in Maxwell to play in Indian Creek.
Cracked sanitary sewer in Ames leaking into Ioway Creek, September 2009
No picture for this one. You’re welcome!
What is the risk of poop in the water?
Recreational water quality standards are based on epidemiological studies at swimming beaches. Researchers have found that swimmers were more likely than non-swimmers to get sick with gastroenteritis (“stomach flu”) and that illness rates were higher at beaches with more fecal indicator bacteria. Symptoms can range from mild to dangerous and are often falsely attributed to food poisoning. The EPA recommended a threshold of 126 E. coli/100mL to keep the risk of illness below a certain level for swimming, water skiing, children’s play, and other “primary contact” activities, but you should think of it as a point on a continuum rather than sharp break between “safe” and “unsafe.” Secondary contact recreation standards are used less often and involve some adjustment factors.
There are many factors that can influence whether you get sick while at the beach—how much water you swallow or get on your face, whether the source of the feces is human or animal, your general health, and previous exposure to the pathogens. There are also some challenges in accurately quantifying E. coli levels in water, which can vary a lot even within the same body of water and over a short period of time. I ran across a randomized control trial from Germany that controlled for all these factors. Some 2000 people were recruited to spend an afternoon at one of four locations (3 lakes and 1 river). Half stayed on shore and half were asked to spend ten minutes in the water, dunk their head at least three times, and report if they accidentally swallowed water. Water samples were collected every 20 minutes from the center of the swimming area and tested for E. coli. Researchers tracked how many people got sick over the next week with symptoms of a waterborne illness. Here are the results.
Water quality (E. coli/100mL), by quartile
Incidence rate of gastroenteritis
Control group
2.8%
0 to 72
1.9%
72 to 181
5.2%
181 to 379
6.6%
379 to 4,600
8.2%
What about really polluted water? An academic review board would never approve an experiment to send 931 people into a bay polluted by a combined sewer overflow, but a group of Danish triathletes was reckless enough to do it for fun. After swimming 3.8 km in water with an estimated 15,000 E. coli/100mL, 42% of them got sick with Campylobacter, Giardia, or E. coli!
There you have it, these are ballpark, intuitive judgements about when to go in the water and when to stay out, but they are informed by good science. Oops, did I just give health and safety advice without running it by anyone?
Prairie Rivers of Iowa is not a medical professional and our work is not conducted under a DNR-approved quality assurance plan, please consult your doctor and refer to section 567-61.3(3) of the Iowa Code, terms and conditions apply.
Bottom line, you may disagree with the interpretation I’ve outlined here, but there’s clearly a lot of wiggle room to enjoy Iowa’s waters without taking unnecessary risks with your health.
Iowa has a lot of hogs, poultry and cattle raised in concentrated animal feeding operations (CAFOs). They produce a lot of manure. However, CAFOs are not evenly distributed across the state, and it’s rarely practical to haul the manure long distances. Do rivers with more CAFOs in the watershed have worse water quality? I was curious and recently completed a big data analysis project to find out. I’ve omitted some of the technical details in the interests of making this article easier to read, but hope to eventually submit this research to a scientific journal for peer review. Get ready for a nuanced, data-driven look at the elephant in the room!
Livestock Density by Watershed
The water quality data for this study comes from 60 sites in Iowa DNR’s ambient stream monitoring network. (Two sites were later dropped because of incomplete data). For each monitoring site, I delineated a watershed (the land draining to that point) and overlaid databases of animal feeding operations. CAFO density in these watersheds varies greatly: from 12 animal units per square mile in Cedar Creek near Bussey, to 883 animal units per square mile in the Floyd River near Sioux City.
Animal units are a way of standardizing herd size across ages and species. For regulatory purposes, one 1000 pound steer is equivalent to 10 pigs under 55 pounds, 2.5 pigs over 55 pounds, 55 turkeys, or 82 layer hens. Feedlots with at least 300 animal units are tracked in Iowa’s database. Feedlots with 500 animal units require a manure management plan, and feedlots with 1000 animal units require a construction permit. The Iowa Environmental Council continues to follow and raise concerns about these rules.
Initial Findings and Complications
In the article that inspired this project, “The Fair, the Marginal, and the Ugly”, Chris Jones used this same dataset to rank water quality in Iowa’s rivers and noted that the river with the worst water quality has the most CAFOs. The Floyd River had the highest nitrogen and total phosphorus, the third highest turbidity, and the sixth worst E. coli. Sticking with the same time period (2016-2020) and similar metrics, I plotted water quality against livestock density for 58 sites to see if the Floyd River is part of a larger pattern. For nitrate, yes; for total phosphorus, maybe; for turbidity and E. coli, no. The relationship with turbidity is weakly negative; rivers with muddier water actually tend to have fewer CAFOs in the watershed.
The best explanation for this is that there is a third factor influencing both water quality and CAFO density: terrain. CAFOs are most common in flatter parts of the state where construction permits are more likely to be approved and there is plenty of cropland nearby to spread the manure. The notable exception to the pattern is Bloody Run, a trout stream in northeastern Iowa. In 2021, the Iowa DNR approved the construction of a 11,600 head cattle feedlot in this watershed, despite the steep terrain and abundant sinkholes. Given the timing, I am excluding this site from analysis and hope we do not have to find out what happens to water quality when this much manure is added to an environmentally sensitive area.
Primary drivers of water quality
To better understand the interactions of multiple variables without a lot of statistics, I like to color-code one of them (in this case, CAFO density) and then focus on a narrow range (in this case, watersheds with less than 160 animal units/square mile). You’ll see this technique several times in this article. This shows how slope and cropland in the watershed influence water quality, independent of CAFOs.
Slope: As you’d expect, turbidity in rivers is strongly correlated with the average slope of land in the watershed. Steep hills are more susceptible to runoff and erosion. Phosphorus and E. coli are also attached to sediment and carried by runoff, so are moderately correlated with turbidity, and weakly correlated with slope.
Cropland: Nitrate in rivers is strongly correlated with corn and soybean acres in the watershed. Long-term nitrate trends can also be explained by changes in cropping patterns (a replacement of hay and small grains with corn and soybeans). I’ve heard corn and soybeans described as a leaky system, and want to echo that. Whether the nitrogen comes from manure, ammonia, or soil organic matter, if you don’t have something green and growing in the early spring, you’re going to lose a lot of it.
Manure and Bacteria in the Water
E. coli is a bacteria found in the guts of birds and mammals, an easy-to-measure proxy for poop in the water and the pathogens that might come with it. For many environmentalists, the reason for Iowa’s long list of impaired waters seems frustratingly obvious. Hogs, poultry, and cattle outnumber humans, dogs, geese, raccoons, and deer, so they must be the main source of E. coli. Here’s an example of that kind of thinking from a report by the Environmental Integrity Project.
“Iowa is America’s hog capital – and also one of the most unhealthy areas in America to swim in rivers and streams. That’s in part because of the vast amounts of hog waste and farm runoff polluting the state’s waterways.”
The same logic showed up in the watershed management plan for Ioway Creek (and some others like it), which assessed likely bacteria sources based on the population of various kinds of animals and the amount of manure they excrete per day. While the consultants were careful not to say that hog confinements in Hamilton County were the main reason for chronically high E. coli in the creek, I sure got that impression from reading the maps and tables.
Looking at livestock populations turns out to be an unreliable way to guess which rivers will have bacterial impairments. Statewide, there is no correlation between E. coli in the river and livestock density in the watershed. The three worst rivers for E. coli in this dataset (the Soldier River near Pisgah, Maquoketa River near Maquoketa, and W. Nodaway River near Shambaugh) have less than 320 animal units per square mile, on the low side for Iowa.
More sophisticated models take into account the fraction of manure that reaches streams, how long it takes to get there, and how much of the bacteria dies off in the meantime. Unsewered communities, geese on the beach, raccoons in the storm sewer, and cows wading in the creek produce much less manure than animals in CAFOs, but a larger fraction of the manure is delivered directly to the water when it’s still fresh. That’s not to say that manure from CAFOs have no influence on E. coli in rivers. Once rivers with slopes steeper than 4% were excluded, the remaining sites had a moderate correlation between E. coli and livestock density.
Manure Nutrients in the Water
If manure is applied to fields that are not too steep and set back from streams, during appropriate weather conditions, and especially if the manure is knifed into the soil, very little of the solids, E. coli bacteria and pathogens in the manure should reach streams. The same is not true of the nutrients in the manure. Nutrients cycle between different forms, and the more readily dissolved forms (nitrate and orthophosphate) can easily leak out of the root zone during periods when crops aren’t growing, and make their way to streams.
Watersheds with a high density of CAFOs tend to have much higher nitrate concentrations, but most of that is because those watersheds also have a large proportion of the land in row crops. However, focusing on sites with at least 80% of the watershed in row crop production, there is still a positive correlation between livestock density and both nitrate and total phosphorus.
In the science assessment for the Iowa Nutrient Reduction Strategy, manure was not treated as a challenge for nutrient reduction, it was treated as a best management practice. It makes a certain amount of sense: manure is a slow-release fertilizer that adds organic matter to the soil. Compared to plots fertilized with commercial fertilizer, plots fertilized with swine manure had 4% less nitrate loss by 46% less phosphorus loss, mainly due to soil improvements that reduced the amount of runoff. However, those agronomic trials must have used a different set of application rates than usually occurs in practice. If you look at both commercial fertilizer sales and manure availability, counties with many CAFOs apply nitrogen and phosphorus at higher rates, with consequences for water quality. Here’s one study from Minnesota and another from Iowa that document this.
Closing thoughts
Prairie Rivers of Iowa has worked with some large swine and cattle producers who were early adopters of cover crops and who are very careful about how they manage manure. We salute their efforts to improve soil health and protect water quality. A study like this can only address the impacts of the industry as a whole.
This project was funded in part by a research grant from the Raccoon River Watershed Association, which has been monitoring water quality in Greene County. Last summer, the group watched with alarm as hog manure leaking from an earthen storage basin turned the water in a creek brown and caused the dissolved oxygen in the water to drop to zero. These kinds of incidents happen way too often, but usually affect a small stretch of stream for a short period of time, so don’t show up in monthly water quality datasets.
The correlations between water quality and livestock density disappeared entirely when I looked at two drought years (2021-2022). During dry periods, runoff and tile drainage from farmland is minimal, but effluent from sewage treatment plants and industry (including meatpacking plants) can have a bigger influence on water quality. Manure from CAFOs definitely impacts water quality in Iowa, but if we’re too quick to blame them in every situation, we may miss what’s really going on.
Our 2023 Annual Report is now available with results of both volunteer and lab testing of water quality in lakes and streams in Story County. The 56-page report can be navigating by clicking on headings in the table of contents or by using the “Bookmarks” feature in your PDF reader. Below are some of the key findings.
The volunteer program continues to grow and improve in consistency.
49 volunteers entered 969 data sheets into the Clean Water Hub this season.
Many volunteers are monitoring their assigned site biweekly, with 20 sites sampled at least 20 times.
This was a challenging year for fish and aquatic insects.
In addition to many creeks drying up, volunteers observed dissolved oxygen drop to low levels at 53% of stream sites.
Biological surveys showed mixed results, with some streams scoring poorly but sensitive insects like mayflies present in others.
E. coli bacteria levels in streams remained high.
All thirteen streams with enough data to evaluate this season exceeded the primary contact recreation standard. Three streams exceeded the secondary contact recreation standard: (West Indian Creek, College Creek, and Ballard Creek.
However, over the last four years, most sites on the South Skunk River meet the standard when there is enough water to float a canoe.
Wastewater treatment plants are not yet capable of removing some of the pollutants we monitor, and can have a large influence during drought when effluent is less diluted.
Effluent from the old sewage treatment plant in Nevada was found to be a major source of E. coli bacteria. The new plant, currently under construction, includes a disinfection system that should address the problem.
Stream sites downstream of sewage treatment plants tend to have elevated chloride and phosphate.
The encouraging trends we noted in the 2022 report held up with another year of data. Water quality trends are often driven by weather, but we pulled out subsets based on streamflow to remove some of this influence.
E. coli in the South Skunk River below the Ames Water Pollution Control Facility has improved relative to the pre-2014 baseline period, especially during dry conditions when wastewater has the greatest influence.
Nitrate in the South Skunk River below the confluence with Ioway Creek improved relative to the pre-2014 baseline period, even after excluding dry periods. This pattern is consistent with improvement from conservation practices.
Prairie Rivers of Iowa has had a busy and productive 2023 in Iowa, working on a variety of important initiatives related to creating a healthier natural environment and preserving the rich cultural heritage of Iowa. As we end this year, we have touched kids, families, landowners, historic homeowners and business owners, communities, natural resource professionals, like-minded not-for-profits and oversaw a national prairie conference in Iowa.
Here’s a summary of some of the key accomplishments and initiatives this year:
EDUCATIONAL VIDEO SERIES – We created a weekly video series for YouTube and Instagram The Clean Water Act: 50 Years, 50 Facts. We produced 45 short videos filmed at dozens of locations (including knee deep in a marsh) and featuring 5 music parodies. The educational videos covered various aspects of water conservation, law and policy.
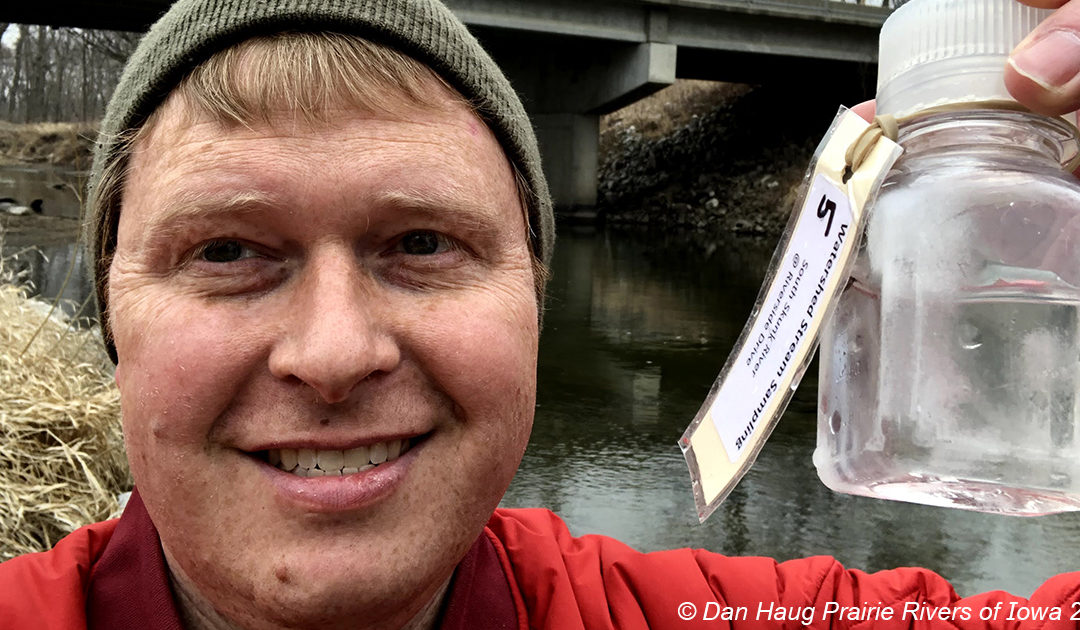
MONTHLY STREAM MONITORING – Conducted monthly monitoring of at least 15 streams, providing updates in the Prairie Rivers monthly newsletter. Additionally, coordinated volunteer “snapshots” with neighboring counties and supported school groups interested in water monitoring. Additionally, we published a 65-page report analyzing water quality data, including a novel way of looking at the data.
SECURED A NATIONAL FOUNDATION GRANT – This grant assists us in building a network for interpreting water quality monitoring data. Seven partners joined Prairie Rivers to focus at sharing best practices, looking for tools to monitor E. coli in our streams, providing a monthly opportunity to express their concerns and planning for an Iowa Water Summit in 2024.
TWO TRASH CLEANUPS — (1) May 2023 — Cleaned Ioway Creek by canoe, S. Grand to S. 16th St (Ames), 40 participants. The trash collected weighed 3,020 pounds and included 20 tires and three rims. Partners included: Story County Conservation, Skunk River Paddlers, the City of Ames, Outdoor Alliance of Story County. (2) August 14, 2023 – Cleaned a tributary of Ioway Creek in Stuart Smith Park (Ames), on foot, nine volunteers, 350 pounds of trash removed. Partners included Iowa Rivers Revival, Green Iowa AmeriCorps and the City of Ames.
POLLINATOR CONSERVATION – Launched a 10-year plan involving over 40 persons serving on a committee to support pollinator conservation. This plan is aimed at conserving pollinators and their habitats, which are crucial for the environment. You can see the plan at www.prrcd.org.
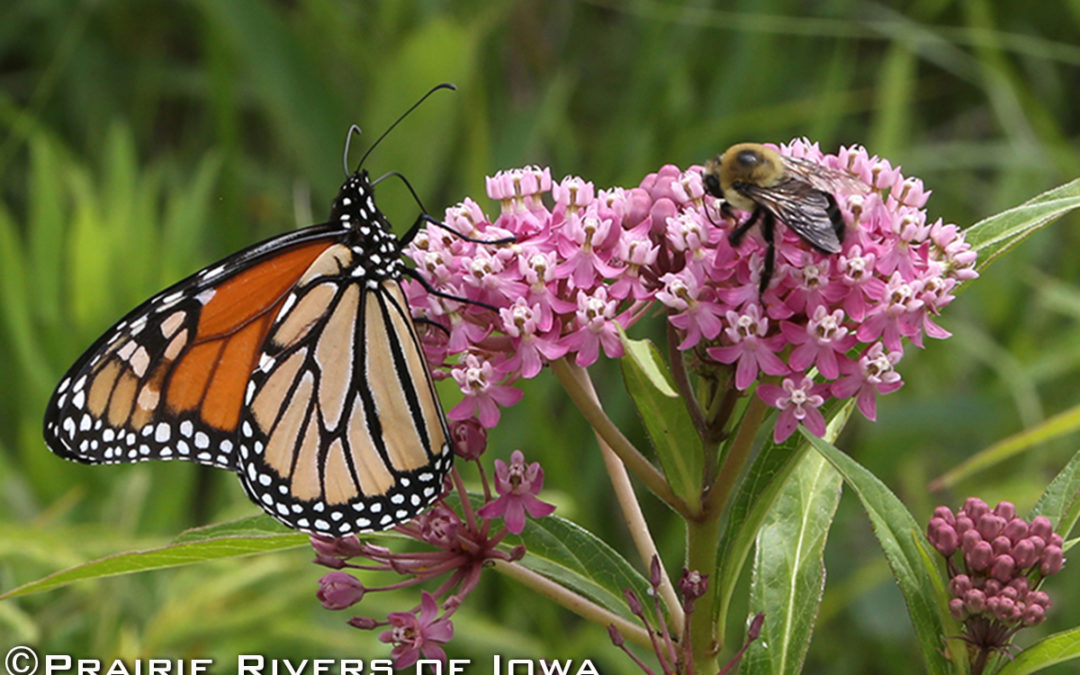
MONARCH MAGIC– Held the first Monarch tagging event in September, where over 300 kids, their families, and others learned about pollinators and tagged 146 Monarchs. We had 10 sponsors and partners at Ada Hayden Heritage Park and plan to do it again in 2024.
HISTORIC RESOURCE PRESERVATION – Received a grant from Iowa Cultural Affairs and successfully surveyed 319 historic listings on the Lincoln Highway Heritage Byway. In 2024, we will present the findings to elected officials and other interested persons in the 43 communities along the Byway to inform and develop a plan for the restoration and preservation of these important Iowa heritage properties.
BYWAY COORDINATOR AND PROJECTS – Hired a new Byway Coordinator, Jeanie Hau, who is actively working to support our Byway projects. Prairie Rivers signed a new contract with the Iowa DOT to support work on the Iowa Valley Scenic Byway extending our efforts to preserve Iowa’s heritage. This Byway begins on Highway 30, Montour turnoff, and travels through the Amana Colonies for a total of 77 miles.
TRAVELING EXHIBIT — The Lincoln Highway Heritage Byway traveling exhibit called The Promise Road: How the Lincoln Highway Changed America has been displayed at various locations, allowing visitors to learn about the rich history of this historic road. It’s available for display in museums, libraries, and other community spaces. So far the exhibit has traveled to Jefferson, Grand Junction, State Center, Nevada, Linn County Historical Society: The History Center, Cedar Rapids History Museum, Nevada Library, Marion Public Library, Carroll Public Library, Harrison County Welcome Center, and currently at the Council Bluffs Public Library.
We cannot do this work without your support!
Today, we are asking you as a supporter to make an end-of-year gift of $50.00 to Prairie Rivers of Iowa. Your support shows us to keep up the good work! You can make a gift here online or by going to our donation page for additional options. We know that as good stewards of the land, you see how important this work is today.
It is so important for a not-for-profit to receive gifts from individuals. Hearing from you encourages and supports our very difficult work in support of the natural and cultural resources in Iowa. Thank you!
Board of Directors Reed Riskedahl, President Mark Rasmussen, Treasurer Doug Cooper, Secretary Erv Klaas Bob Ausberger Chuck Stewart Rick Dietz Jim Richardson Christopher Barber
Staff Mike Kellner, Marketing and Public Relations Dan Haug, Water Quality Specialist Jessica Butters, Pollinator Conservation Specialist Jeanie Hau, Lincoln Highway Heritage Byway & Iowa Valley Scenic Byway Coordinator Carman Rosburg, Office Manager Daniel Huber, Technology Shellie Orngard, Historic Properties Consultant
The Conservation Learning Group, a think tank based at Iowa State University Extension and Outreach has announced the 2022 winners of its New Voices in Water Quality Awards. Prairie Rivers of Iowa Water Quality Specialist Dan Haug is one of 15 Iowans being awarded. Haug was recognized for his excellence in youth and/or community water education.
In a recent Conservation Learning Group release, its director Jacqueline Comito said, “Each of these individuals was nominated by peers and recognized for their efforts, achievements and passion for improving and restoring water quality.”
The Outdoor Alliance of Story County (OASC) has worked with Prairie Rivers of Iowa, and particularly Haug, on a number of projects. In their nomination letter, the board cited Haug for his expertise at analysis and reporting, his role as an outstanding communicator and his leadership during water quality monitoring and creek cleanup events. “We recall a cold April morning when Dan trained volunteers on identifying macroinvertebrates from Ioway Creek.His enthusiasm was infectious, and the volunteers had fun collecting and examining the samples despite the very cold water,” the OASC further states in the letter.
Volunteers searching for macroinvertebrates.
Haug teaching water quality testing.
Iowa State University (retired) Teaching Assistant Professor of Agronomy Laura Merrick said of Haug, “Dan has been my closest collaborator starting in 2017 on a variety of citizen-science and community-based water quality monitoring and watershed-centered coalition-building initiatives. He has grown to serve in a central guidance role to transform the nature of community collaboration for monitoring and sustainable improvement of our regional water quality in surface rivers and streams and to promote youth and community water education.”
Among Haug’s many accomplishments, starting in the spring of 2020 he was instrumental in assembling in Story County a 24-member planning team that developed a 10-year water monitoring plan with Haug as its primary author. He then subsequently authored its first annual report.
“As nice as it is to be recognized by the Conservation Learning Group as part of this dedicated group of water professionals, it was even more gratifying to know that nine friends and colleagues in seven different organizations sent nomination letters on my behalf. It really speaks to the level of collaboration we have around water monitoring and watershed projects,” Haug modestly relates.
According to Prairie Rivers of Iowa Director Penny Brown Huber, “Trying to solve critical water quality problems takes dedicated people to understand what is happening. Dan is a key link to helping the public build their understanding so change can happen to improve water quality.”
To meet all the New Voices in Water Quality Award winners visit newvoicesinwater.org.
Water quality demonstration at water plant open house.


 vs livestock density in the watershed")
 vs livestock density in the watershed")


 under magnifying glass")