An Impressive 2022 Stream Monitoring Season

An Impressive 2022 Stream Monitoring Season

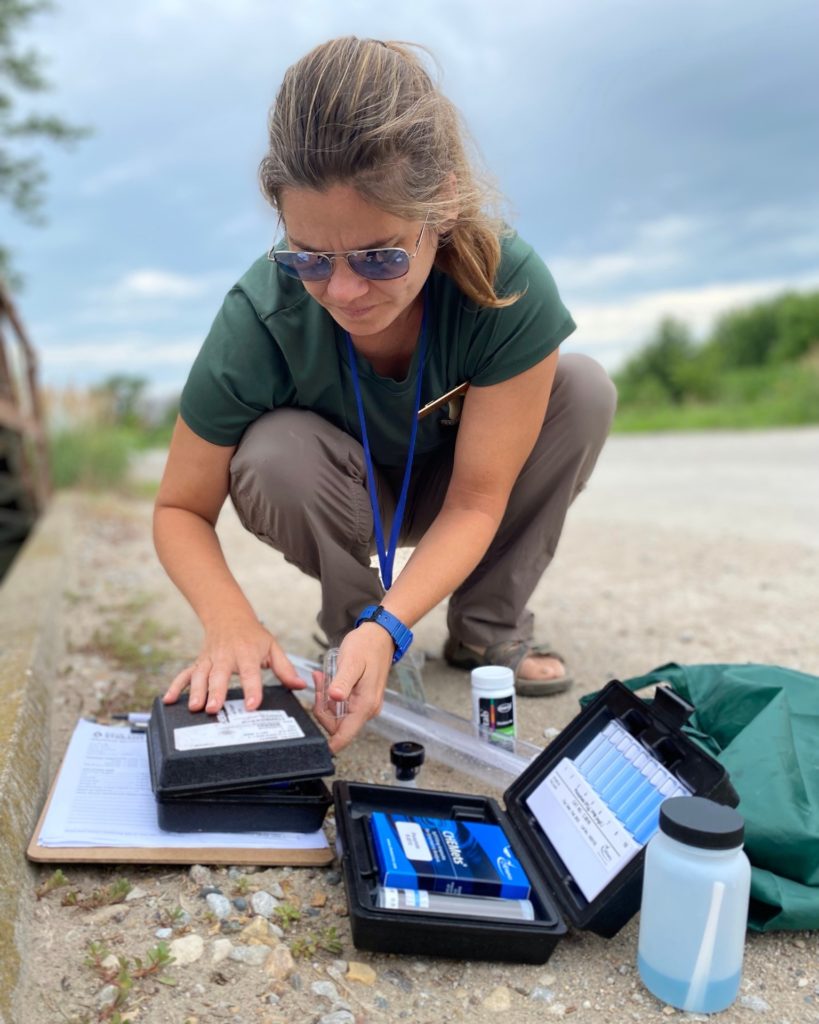
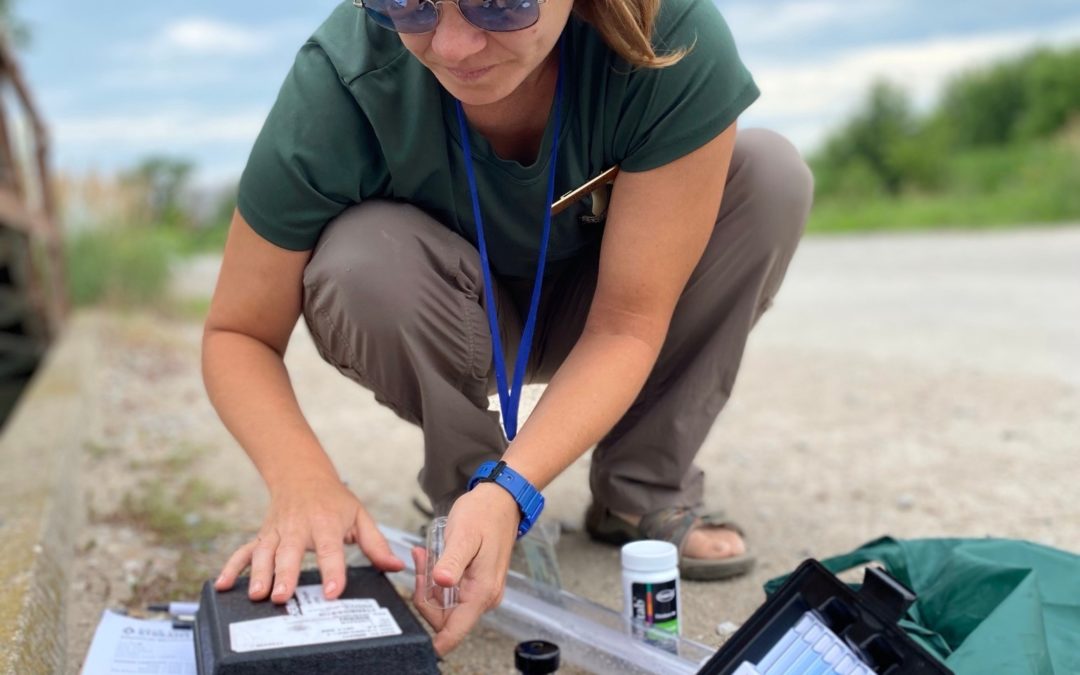
Jess Lancial testing water

Jess Lancial testing water quality (photo credit Story County Conservation)

Volunteer Water Monitoring in Story County

A round of applause for all the volunteers and Story County Conservation staff who have diligently been monitoring their assigned stream twice a month in all kinds of weather!   Also, let’s give a shout-out to the people who work behind the scenes.  Sara Carmichael of Story County Conservation keeps everyone on track and equipped with supplies.  Heather Wilson of the Izaak Walton League of America provides training and support to volunteers around the state.  We rely on the IWLA’s  Save Our Streams program for training materials and the Clean Water Hub for data entry.  The three of us will be meeting the volunteers at a training event later this month to kick off another great season.

Three ways to get involved:

  • There’s room for one or two more volunteers to cover a site in Story County, so contact Sara.
  • If you’d like to try water monitoring without committing to a schedule, Prairie Rivers organizes a one-day volunteer event in the Ames area each May, so keep an eye on our events page.
  • If you don’t live in Story County, the Izaak Walton League is launching a new Nitrate Watch program and you can request a bottle of test strips while supplies last.

In March, Prairie Rivers will release a report detailing the findings, but for now let’s admire the scale and consistency of the effort, which has really improved since last year. (Updated 2023-02-18 to include some data sheets that were entered late)

2022 Season

Volunteers participating

Sites tested at least once

Sites tested at least 10 times

Sites tested at least 20 times

Data sheets entered in the Clean Water Hub

2021 Season

Volunteers participating

Sites tested at least once

Sites tested at least 10 times

Sites tested at least 20 times

Data sheets entered in the Clean Water Hub

Story County Water Monitoring & Interpretation Plan, 2021-2030

Prairie Rivers partnered with Story County and 8 other organizations to develop a ten-year Water Monitoring & Interpretation Plan for Story County.  Regular communication between the various groups testing water helps avoid duplication and leads to new opportunities to improve water quality.  Planning for how data can be used over the long term ensures that we get the most value from our time and effort.   Read the plan here

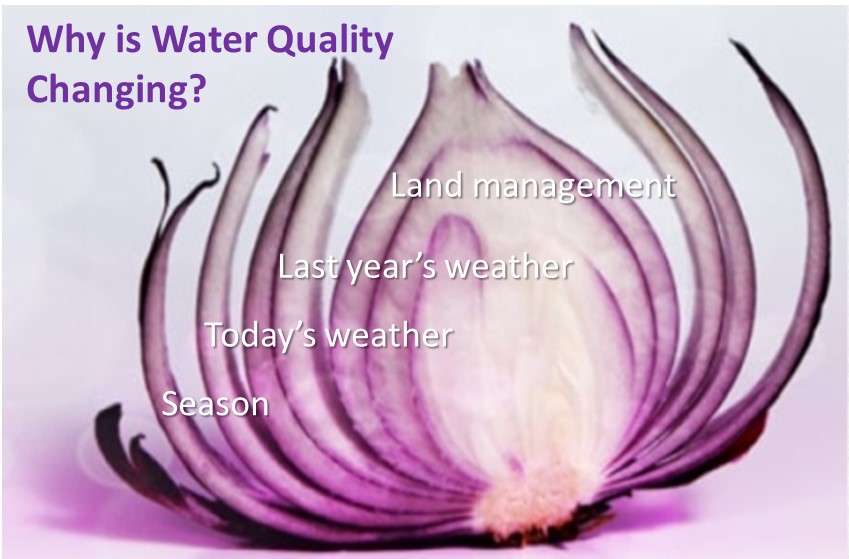
Peeling the Onion

Peeling the Onion

We know that weather influences water quality in Iowa’s rivers.  Last year, there was a drought and nitrate was lower than usual.  This spring, it’s been wetter and nitrate is higher than usual.  If you monitor for 10 years and the first 5 are a little wetter or drier than the last five, you’ll a water quality trend to go with it.  Boring! 

What we really want to know is how people are influencing water quality.  We can get a lot closer to that answer by peeling away the obvious weather-related patterns to reveal underlying trends.

In statistics, it’s called a covariate or an explanatory variable.  If there’s a relationship between your water quality metric and some other thing you’re not really interested in (i.e. streamflow), you can model that relationship to account for part of a water quality trend over time.  What’s left over might be the things you’re really interested in (i.e. how water quality has been affected by changes in crop rotations, conservation practices, sewage treatment, manure management, and drainage).  It’s common enough in the scientific literature (Robert Hirsch’s Weighted Regression on Time, Discharge, and Season is a good example), but should be used more often for progress tracking at the watershed scale. 

To illustrate this general approach, I downloaded daily nitrate data from three stations maintained by the US Geologic Survey.  The sensors at the Turkey River at Garber and the Cedar River near Palo (north of Cedar Rapids) were installed in late 2012; the sensor Raccoon River near Jefferson was installed in 2008.  I wanted a high frequency dataset (to minimize sampling error) that included the episodes of “weather whiplash” in 2013 and 2022.

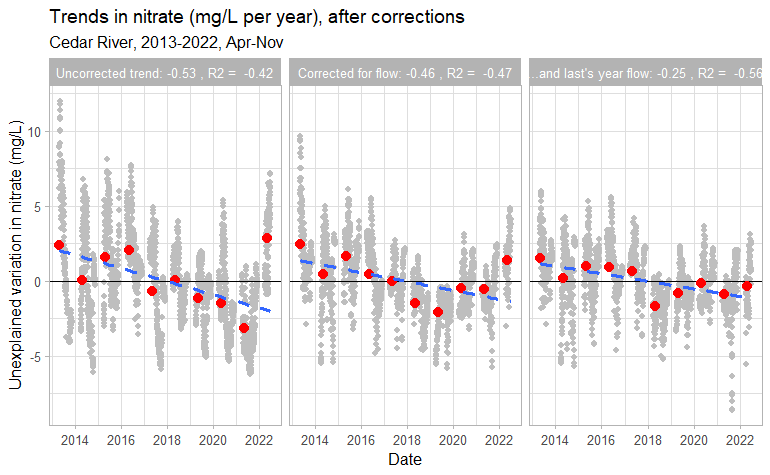
nitrate trend in the cedar river

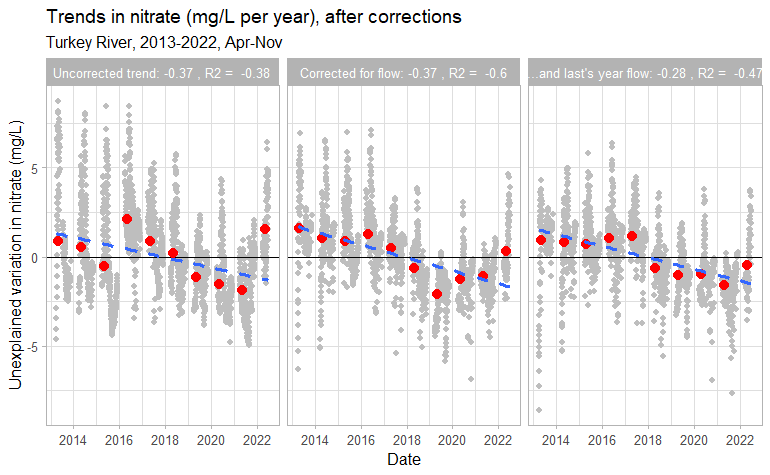
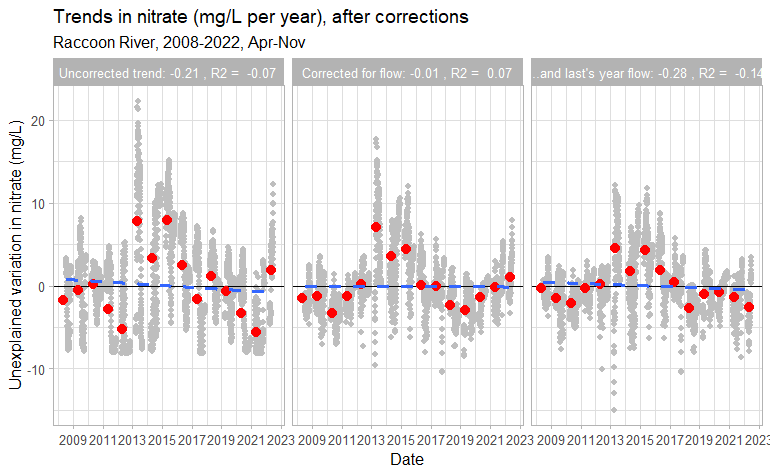
“Residuals” are the difference between what we predict and what we measured.  In the first panel, that’s the difference between a measurement and the long-term average.  In the second and third panels, we see how nitrate measurements differ from what we’d expect given flow in the stream today, and flow in the stream last year.  Gray dots – daily measurements.  Red dots- yearly averages.  Blue dotted line – trend.  If I did this right, some of the dots should get closer to the middle.

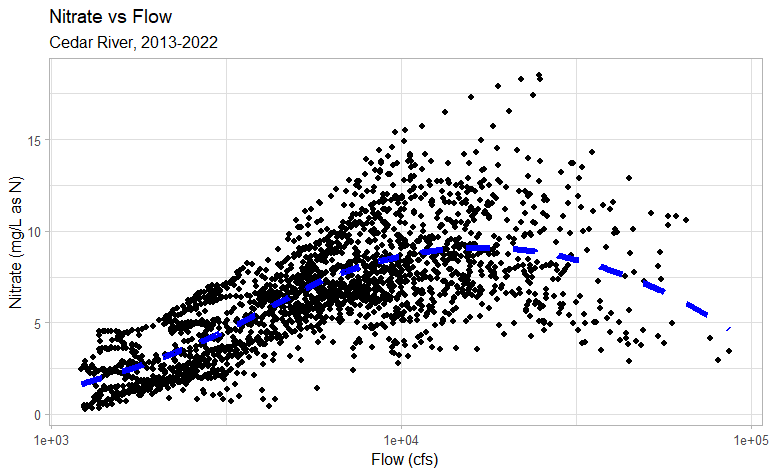
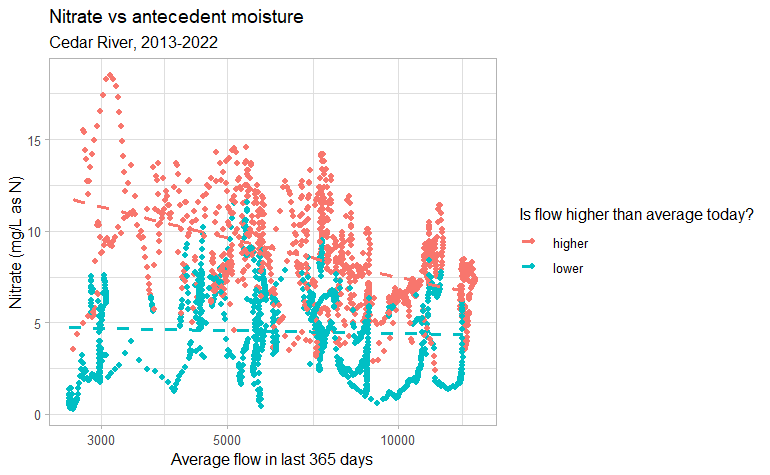
Nitrate concentrations in rivers increase as the weather gets wetter and streamflow increases… up to a point.  When rivers are running very high, there’s a dilution effect and nitrate concentrations fall.  Based on that relationship, we can explain high nitrate levels in the Cedar River in 2016 (a wet year) and low nitrate levels in 2021 (a dry year).

nitrate vs flow in the Cedar River

Nitrate concentrations tends to be highest on wet spring days following a dry summer and fall, as nitrate that accumulated in the soil during the drought is flushed into drainage systems or washed off the land surface and into rivers.  Here I’ve calculated a moving average of flow over the previous 365 days, and compared that to nitrate concentrations during high flow or low flow conditions.  Based on that relationship, we can explain high nitrate in the Cedar River on wet days in the spring of 2013 and 2022 (following a dry year) and low nitrate on wet days in the spring of 2019 (following a wet year).

relationship between nitrate and last year's flow

After making these adjustments, the downward trend in the Cedar River looks much smaller (0.53 mg/L per year, adjusted to 0.25) and is overtaken by the Turkey River (0.37 mg/L, adjusted to 0.28).  The adjusted trends are statistically significant and could be attributed to conservation efforts in those watersheds.

How did I do this?  For technical details, read here.

nitrate trend in the cedar river

However, there’s still some weather-related patterns we haven’t accounted for.  The Raccoon River near Jefferson also had a steep decline in nitrate since 2013 (1.42 mg/L per year, adjusted to 0.77 mg/L per year) but if you look at the entire record (going back to 2008), it’s part of an up-and-down cycle.  I’ve seen that same pattern in the South Skunk River.  The model explains some of those swings but doesn’t fully explain high nitrate in fall of 2014, spring of 2015 and spring of 2016.  Perhaps the nitrogen that accumulated in the soil during the drought of 2012 took several years to flush out.

In addition to streamflow and last year’s weather (antecedent moisture is the technical term), nitrate can be explained by season, soybean acreage, and baseflow.  If it’s not enough to know that water quality is improving or getting worse, and you’d also like to know why, then let’s peel that onion!

Volunteers in the Creek All Week

Volunteers in the Creek All Week

Trash Cleanup

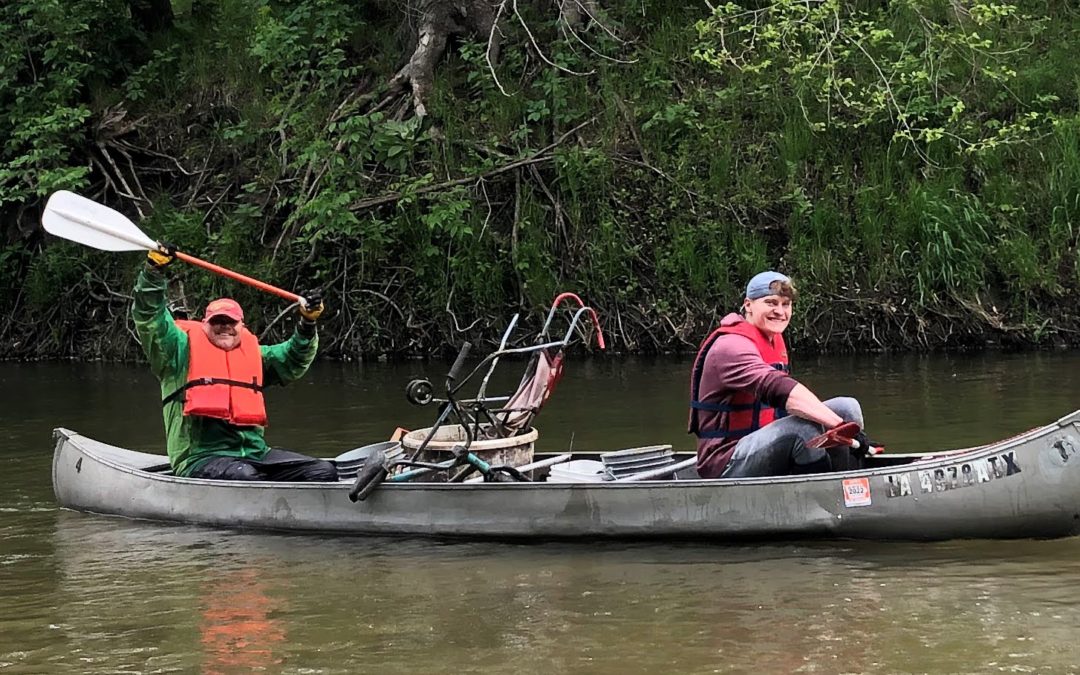
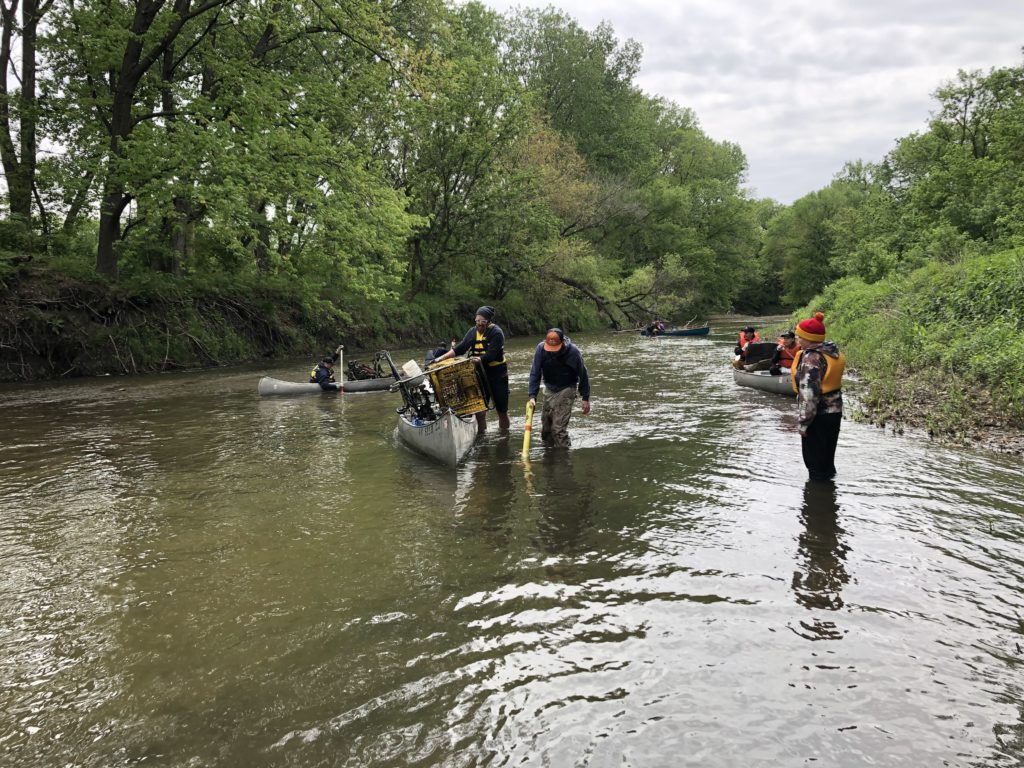
Ioway Creek recently got some love from the community.  On Saturday, May 21, a group of seventeen volunteers (plus another four helping on land) loaded nine canoes with trash as we floated from Brookside Park down to S. 16th Street in Ames.  We hauled out 14 tires and 1,560 pounds of other trash including 3 shopping carts, a tent, and two bicycles.  Assembling the tools, canoes, food, and people was a collaborative effort involving Prairie Rivers of Iowa, the City of Ames, Story County Conservation, the Skunk River Paddlers, and the Outdoor Alliance of Story County.  A few people got wet, everyone got dirty, my muscles are still sore, but we all had a good time on the river!

volunteers testing water quality

Citizen Science

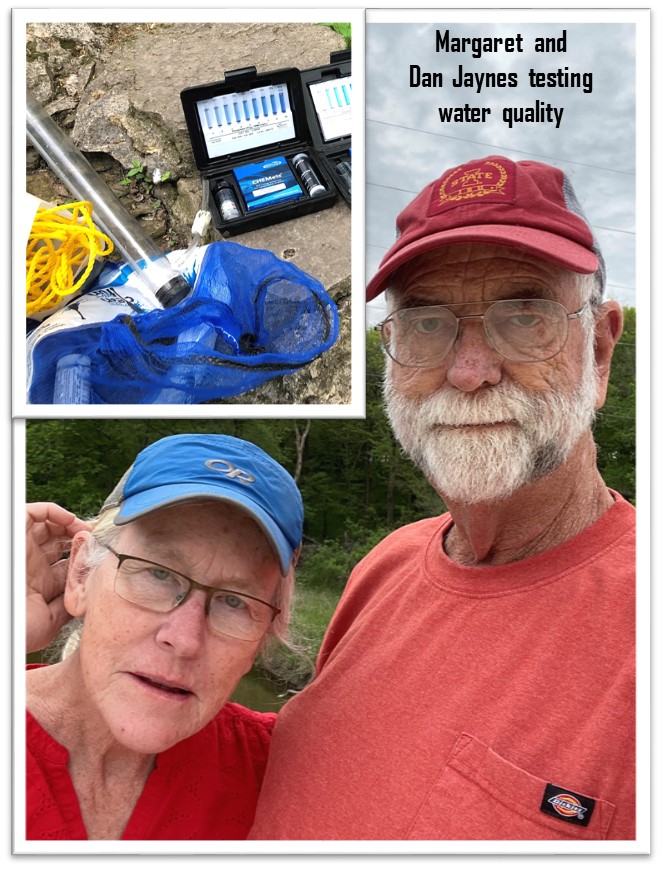
On Tuesday May 17, fourteen volunteers tested water quality in Ioway Creek and its tributaries. This is the fifteenth Spring Watershed Snapshot, and the fourth that Prairie Rivers organized. Thanks to the Outdoor Alliance of Story County for help with supplies.  This year, some volunteers were already doing regular monitoring of a site for Story County Conservation and adjusted this month’s schedule to coordinate, or picked up a few extra sites. If we include other watersheds and other days tested during the same week, the count is 22 volunteers (and also some Story County Conservation staff) and 47 sites in Story, Boone, and Hamilton counties.

We scheduled the event for a weekday this year to coincide with Polk County’s snapshot, so while the event was less social than it sometimes is (volunteers could pick up a kit any time on Tuesday and test their assigned sites alone or with a friend), they were monitoring as part of a big coordinated effort of the kind that we haven’t seen since before the IOWATER program was cancelled!  In Polk County, 75 people covered 115 sites!

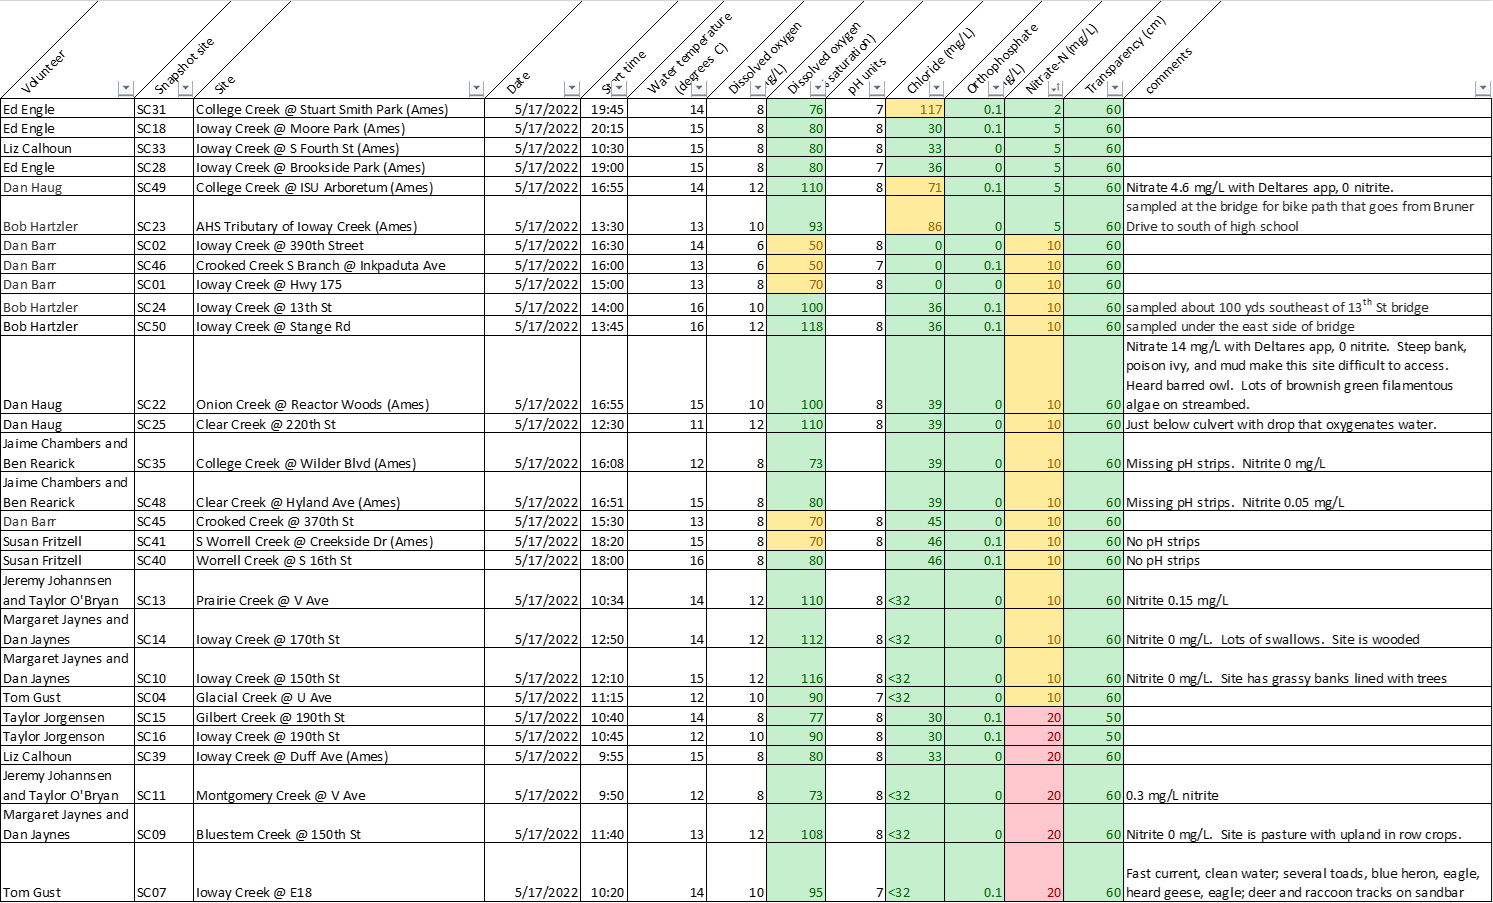
A table with our findings are shown below, and a map of the sites can be found here.  On Tuesday, the water was clear and phosphorus was low at all our sites.   Chloride was highest and nitrate lowest in creeks with more urban watersheds.  Dissolved oxygen fell into the “fair” range at several sites in Hamilton County, as well as the south fork of Worrell Creek in Ames.  Nitrate was 10 mg/L or higher at most sites, but reached 20 mg/L in the middle sections of Ioway Creek and several rural tributaries.  I did some followup testing to make sense of the high nitrate levels at Duff Ave, more on that later.

Thanks to all the volunteers who spent some time in a creek last week!

5-2022 Water Quality Snapshot Results
Prairie Rivers of Iowa Releases Story County Water Quality Monitoring Annual Report

Prairie Rivers of Iowa Releases Story County Water Quality Monitoring Annual Report

Prairie Rivers of Iowa has just released an annual report investigating water quality in streams and lakes around Story County. Prairie Rivers of Iowa worked with Story County Conservation, the City of Ames, and other partners in 2020 to initiate a locally-led water monitoring program including both volunteer and laboratory testing.

The report’s author Prairie Rivers of Iowa Water Quality Specialist Dan Haug states, “Our partners and volunteers have gone to a lot of trouble to test rivers and lakes across the county, so we take seriously the job of interpreting the data.”  He continues, “It’s only the second year of the program, but we’re starting to see patterns that can help us evaluate nutrient reduction efforts and improve our streams for recreation and fisheries.

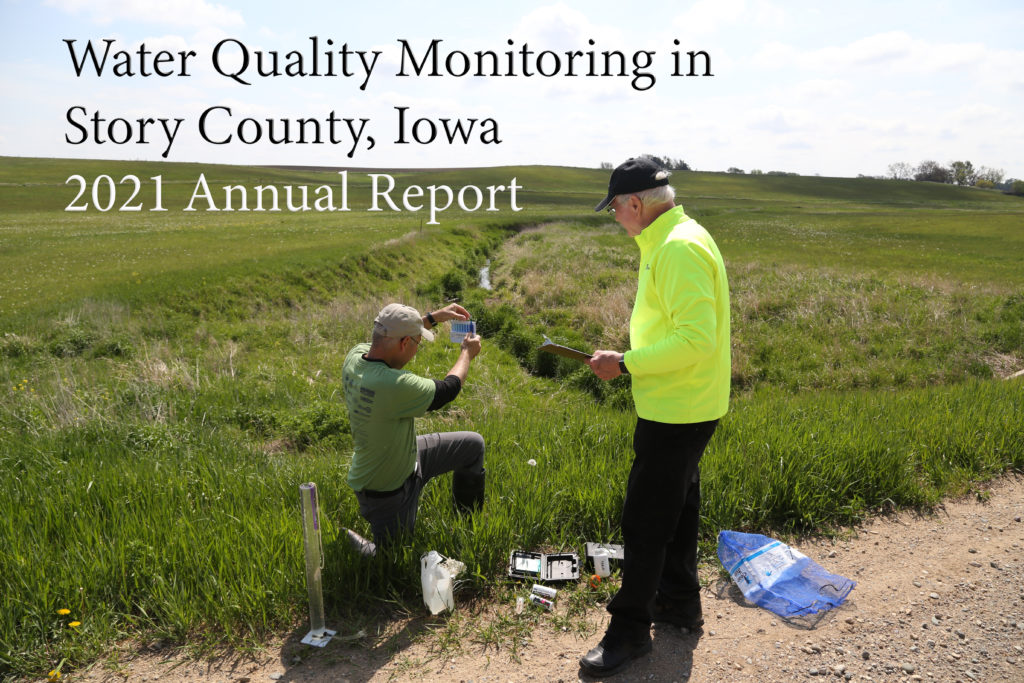
Water Quality Monitoring in Story County Annual Report Cover

Volunteer Rick Dietz and Prairie Rivers of Iowa Board President Reed Riskedahl test phosphorous in a tributary of Ioway Creek.

Some of the key findings detailed in the report include the risks of waterborne illnesses, algae blooms in lakes and streams, the impacts to aquatic life and the effects of excess nutrients being sent downstream, eventually to the Gulf of Mexico.

“The water monitoring planning team is working hard to bring together all the resources we can to conduct monthly water testing, equip volunteers, educate elected officials and the public about the many water quality issues in our lakes, rivers and streams,” according to Haug.

In 2021, E. coli bacteria was usually low at swimming beaches and parts of the South Skunk River, but high in most creeks. The influence of nitrogen and phosphorus loads from Story County did not have as much influence on hypoxia contamination to Gulf of Mexico in 2021 due to a dry year, but the plan calls for continued monitoring to determine the effects during normal to wet periods helping to identify hot spots and evaluate whether conservation practices are working.

Water quality monitoring results in Story County did however reveal that during dry conditions in 2021, the highest levels of nitrogen and phosphorus were found below wastewater treatment plants. Wastewater effluent may be contributing to low dissolved oxygen levels in some streams harming aquatic invertebrates yet more monitoring is needed to establish patterns.

Other findings during the past year conclude that untreated stormwater from older neighborhoods has extremely high levels of sediment, phosphorus and bacteria.

Water monitoring was guided by a ten-year plan written by nine local partners and facilitated by Prairie Rivers of Iowa.

Water samples were collected monthly from 15 sites and weekly from three sites, with laboratory support provided by the City of Ames. Story County Conservation launched a volunteer monitoring program with 17 individuals and one business participating. Prairie of Iowa used special hardware to collect samples of runoff from rainstorms.

The entire Story County 10-year Water Quality Monitoring Plan, Annual Report, water quality updates, real-time data and educational articles can be found here.