For Iowa History Month, I’d like to talk about legacy sediment—historic erosion that has a big influence on sediment, phosphorus, and fisheries in rivers today. For a change of pace, this article is written at the fourth-grade reading level. I like big words like “fluvial geomorphology” but not everyone does. Okay! Let’s have some fun learning!
The faster the water moves, the more stuff it can carry. Fast-moving water washes away the tiny stones (sand and silt). It leaves behind the bigger stones (gravel). Slower moving water washes away the silt but leaves behind the sand. If a beaver or a person dams up the water and it really slows down, even the silt settles out. That’s why mountain streams have rocky bottoms but lowland streams have muddy bottoms. It’s also why there are sand bars on the inside of river bends where the water moves more slowly.
Photo by Dan Haug. Note the transition from silt to sand to gravel to rocks going left to right from slower to faster water.
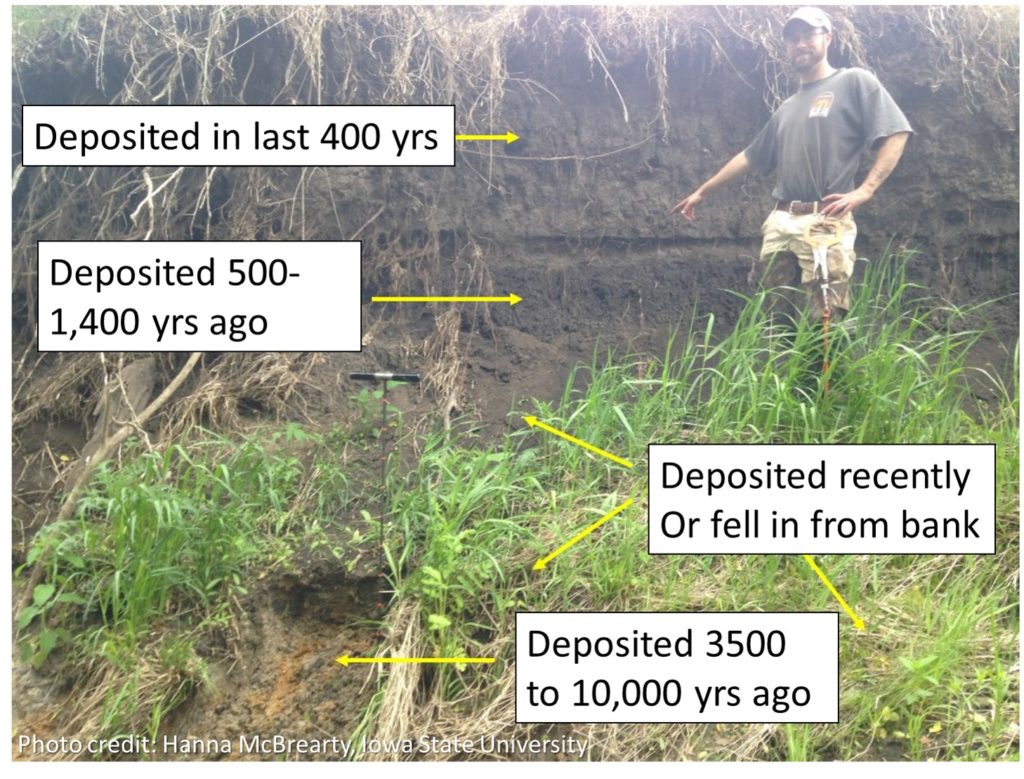
Plants’ roots and leaves can keep dirt from washing away, and so do the tiny things that live on plant roots. They actually make a glue that holds the dirt together! There’s been a few times when dirt and rocks moved a lot faster than normal because there weren’t any plants growing. Twelve thousand years ago, there weren’t any plants in my part of Iowa because the land was covered in a big sheet of melting ice. It happened again 190 years ago when farmers started moving in and plowing up the grass to grow crops. The ground was bare for most of the year, so dirt washed off the hills and filled up the valleys. 90 years ago, farmers realized this was a problem and got more careful about how they plowed. But then 50 years ago some of them forgot and weren’t as careful. But they remembered again, so it’s better now. (Read more about this history here)
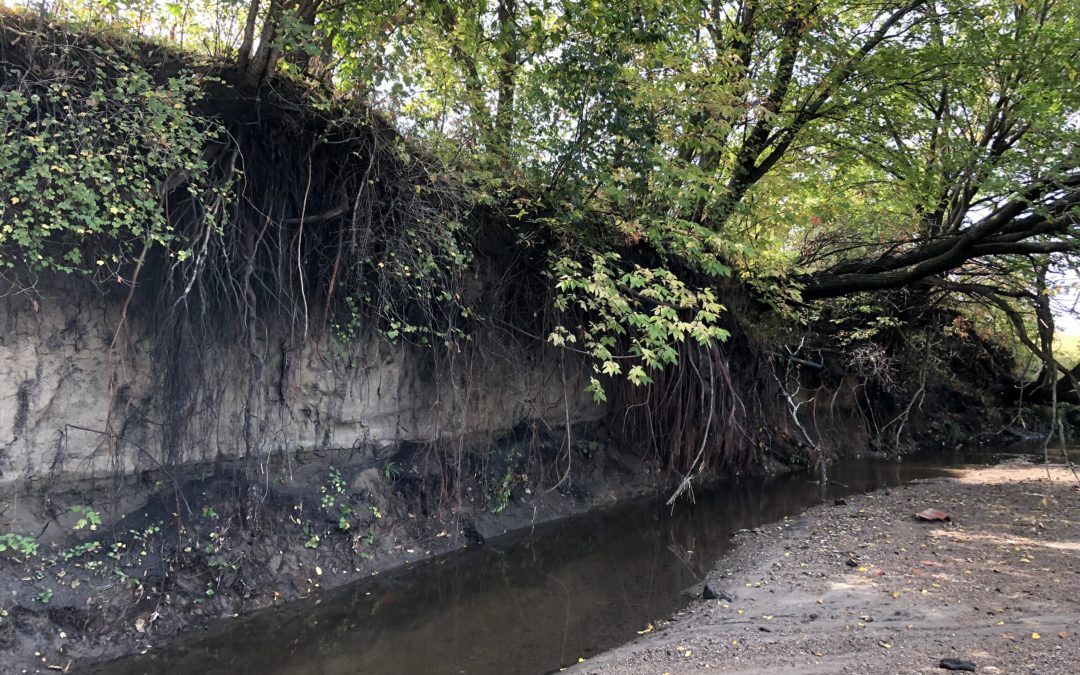
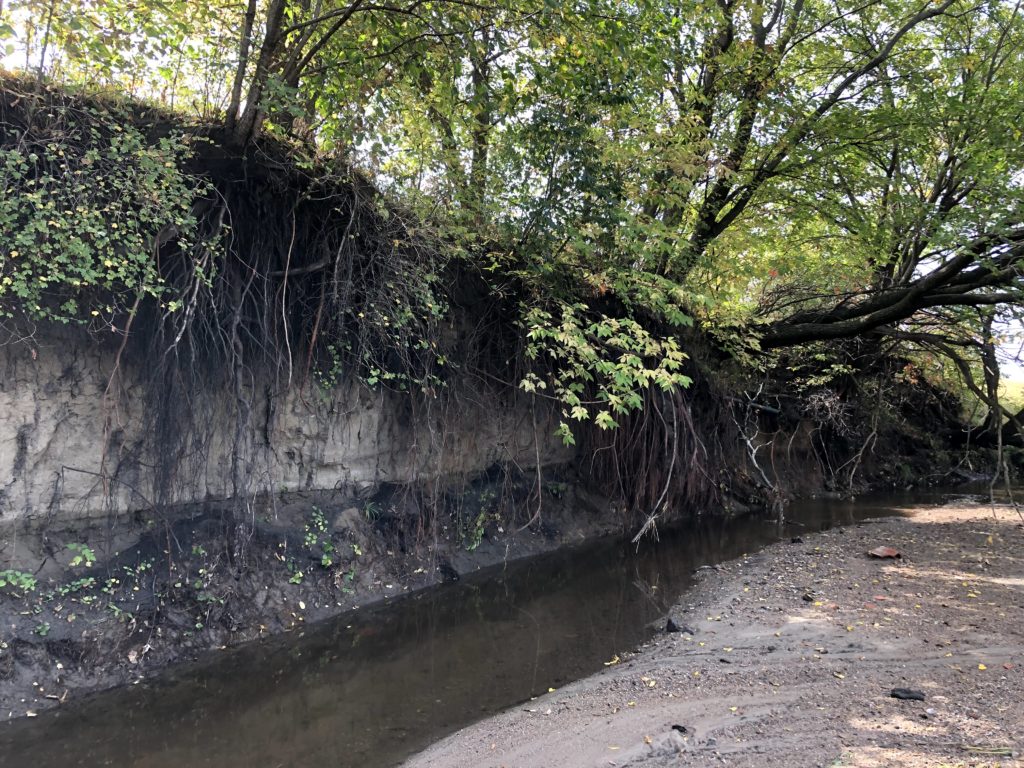
There’s still lots of soft mud in the valleys from those days. That’s a problem because the water moves a lot faster now. Partly that’s because there’s more pavement and fewer marshes. Partly that’s because people straightened out some of the curves in the rivers. The fast water hits the soft mud and makes little canyons all over Iowa. The water can’t get out of the canyons unless there’s a really big flood so it almost never slows down. The canyons are not as pretty as the Grand Canyon and the fish don’t like them as much. The soft mud in the river valleys also has fertilizer in it that can make the water turn green. The fish don’t like that either.
Photo by Dan Haug. Steep bank in Ioway Creek in Ames.
If you like fish and want the ugly canyons to turn into normal-looking rivers you have two choices.
1. You can stop dumping concrete on the river banks and wait. The water will keep washing away dirt on the outside of the river bend. That makes the valley wider. Some day, the bank will cave in. That will make the valley less steep. Some houses and bridges might fall into the river too. That would be exciting!
2. You can use a backhoe to move the dirt around so the valley isn’t as steep and narrow. I like that idea better. It would also be a good idea to have trees and grass near the river to hold the dirt together.
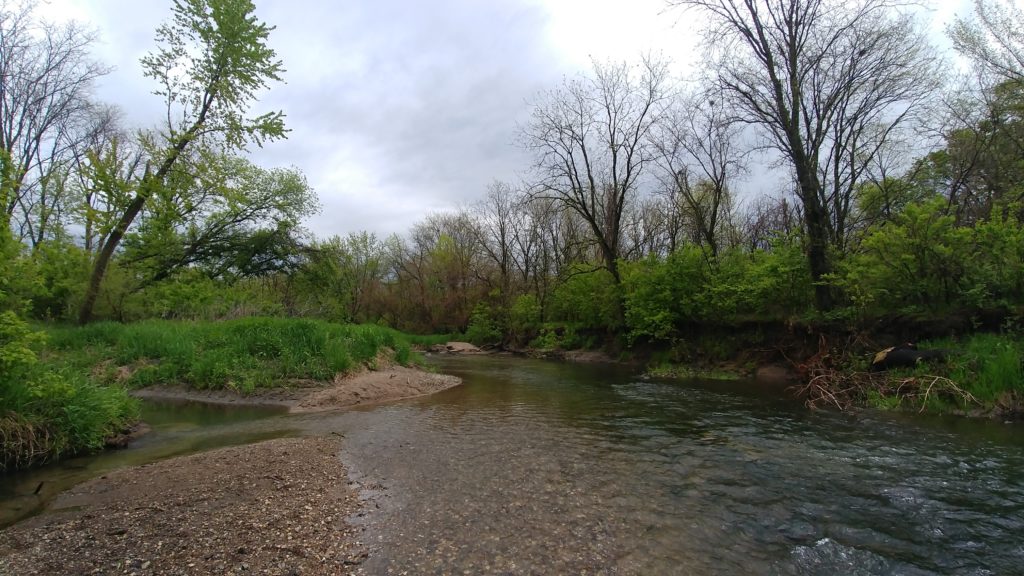
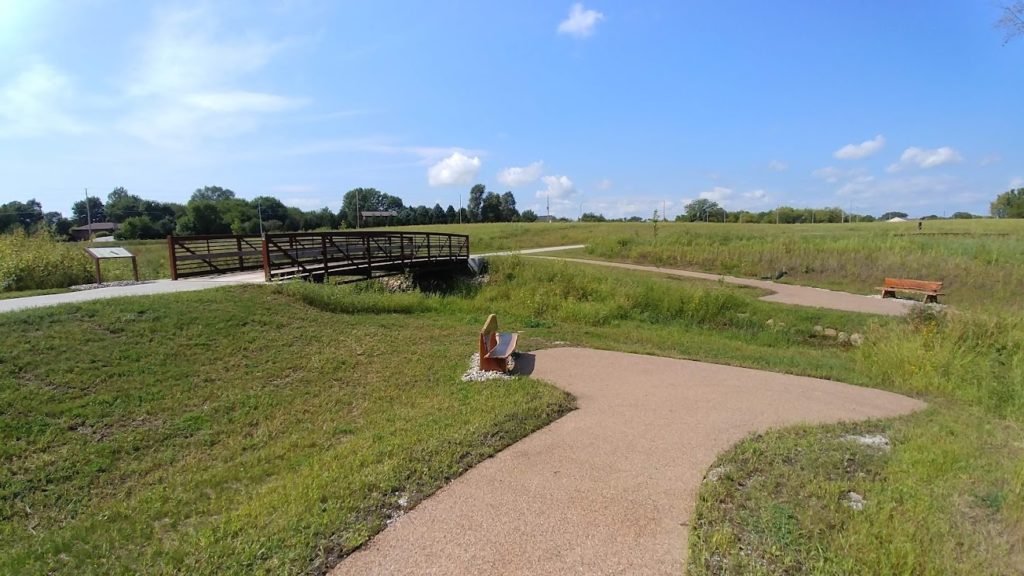
Photo by Dan Haug. The stream at the Tedesco Environmental Learning Corridor doesn’t look like a canyon anymore because the county brought in a backhoe to restore it.
If you like reading about science and engineering with very small words, I recommend a funny book called Thing Explainer by Randall Munroe.
If you want to learn the big words too, then I think you should listen to Jeff Kospaska at the Iowa Department of Natural Resources, Tom Isenhart at Iowa State University, or Billy Beck at ISU Extension. I learned a lot from them!
Many Iowans would like to know which lakes and rivers are safe for recreation and good for fishing because that affects how they’ll engage with the outdoors. They would like to know whether water quality is improving, and if not, what kinds of changes on the land would make a difference. Regardless of whether you think the right way to improve water quality is through voluntary projects, legislation, or some combination, we need good information to guide our efforts. However, for all the attention it gets, the 2022 Impaired Waters List does not really tell us which waters are safe for recreation or the direction of statewide trends.We think that’s a missed opportunity.
By the Iowa Department of Natural Resources (IDNR) own admission:
“An increase or decrease in impaired waters does not necessarily mean that the water quality in the state is worsening or improving. It could be a reflection of the additional monitoring we are conducting, changes in water quality standards, and changes in assessment methodologies. Impaired segments are often used for recreation and fishing, among other uses, so impairment doesn’t mean that the segments are unusable.”
-Roger Bruner, Supervisor, Water Quality Monitoring and Assessment section, IDNR
While there’s a lot of good science that goes into Iowa’s water quality assessment database, the list of impaired waters is not a scientific study of water quality status and trends. (The United States Geological Survey actually does that through a national program you’ve probably never heard of). 303(d) lists are legal documents written by state natural resource agencies for the Environmental Protection Agency, as required by Section 303(d) of the Clean Water Act. Even if the IDNR wanted to make things clearer for the public, many of the terms and categories are defined by federal rules and linked to other regulatory processes.
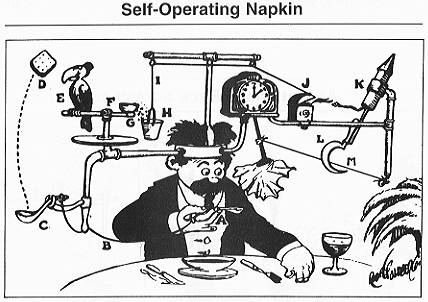
In other words, the Impaired Waters List is part of a Rube Goldberg machine! If you’d like to comment on the draft list before March 19 — either to ask questions about particular water bodies or to express your opinion on Iowa’s larger approach to water quality — you may benefit from the following explanation of the machine.
Disclaimer: I am not an environmental lawyer or policy expert, and am probably not treating the subject with the seriousness it deserves .
I don’t mean to throw shade on thestaff at environmental agencies or the Clean Water Act. The 1972 law is the reason why American rivers mostly don’t burst into flames anymore. Some lakes and rivers in Iowa have benefited from the process described above, which results in technical information, stakeholder engagement, and grant funds that can help improve water quality. One example I’m familiar with is Hickory Grove Lake in Story County, which is now on its way to recovery. However, many other water bodies have gotten stuck somewhere in the process. I’ll share some examples from Central Iowa.
Step One: If the water was clean, could you swim or fish in it?
The goal of the Clean Water Act was for our waters to be swimmable and fishable by 1983 (yes, we missed that deadline). “Designated uses” for each lake and stream segment clarify what kind of recreation or aquatic life is possible, and these affect which water quality criteria are applied. For example, the Iowa River at Eldora has plenty of water for fishing, swimming, and paddling (so is designated A1 B-WW1). The South Skunk River at its headwaters near Blairsburg is too shallow for any of these uses, regardless of water quality (so is designated A2 B-WW2). As a result of this difference in designated uses, the Eldora Wastewater Treatment Plant must meet stricter E. coli and ammonia limits than the Blairsburg Sewage Treatment Plant.
However, perhaps one-half of the waters in the database have an asterisk next to the designated use. Most smaller creeks in Iowa are presumed to support primary contact recreation until the IDNR determines otherwise, through on-site investigation and surveys of residents. For example, Long Dick Creek in Hamilton County does not have enough water to float a canoe, but since no permit is affected by this determination, Iowa DNR has never been asked to find out. If they did a use attainability analysis, Long Dick Creek would probably not be on the Impaired Waters List — it has E. coli levels exceeding the primary contact standard, but below the secondary contact standard. For this creek, both the impairment and the protections provided by the Clean Water Act are hypothetical.
When a use attainability analysis is done, the conclusions can be confusing. I had understood secondary contact recreation to mean “shore-fishing” but is often paired with a designated use for aquatic life that implies there are no fish worth catching. I had understood primary contact recreation to mean “deep enough for canoeing”, but IDNR uses it to mean “deep enough to accidentally go swimming if you tip your canoe”.
Step 2: How clean does the water need to be for fishing and swimming?
Here’s an example of how the factual questions about the condition of Iowa’s waters get tangled up in economic and legal questions about how to address it. We know that algae blooms can kill fish and become a nuisance (or a safety issue) for swimmers and boaters. We know that phosphorus and nitrogen contribute to algae blooms in Iowa waters. We have lots of data about nitrogen and phosphorus in Iowa waters. We even had a study by IDNR staff examining the relationship between nutrients and aquatic life. What we still don’t have is numeric criteria to translate nitrogen and phosphorus data into “fully supporting”, “partially supporting” or “not supporting” for fishing and recreational uses of lakes and rivers.
Why? Because water quality criteria are not just used to make sense of the data; they are also used to regulate wastewater treatment plants. Iowa’s Environmental Protection Commission has rejected calls to establish numeric nutrient criteria because they were concerned it would put too heavy a cost on municipalities. It’s a valid concern — one that other states have dealt with through permit variances and nutrient trading systems.
Step 3: Is the water clean enough for fishing or swimming?
Assessments are done every two years using recent (but not current) data. The 2022 cycle uses data from 2016 to 2020.
Don’t expect a comprehensive list. Iowa has many lakes and streams and Iowa DNR does not have the resources to monitor them all. Almost one-half of the waters (49% of the river segments, 48% of lakes and reservoirs, and 18% of wetlands in the database) were not assessed for the 2022 cycle.
Even this is overstating how much we know. Most waters are assigned a designated use reflecting what kind of recreation is possible (Class A) and what kind of aquatic life is possible (Class B). The IDNR has conclusive enough data to say whether or not aquatic life uses are supported for 21% of river segments and 33% of lakes and wetlands. IDNR has conclusive enough data to say whether Recreational Uses are supported for 19% of river segments and 57% of lakes and wetlands.
Step 4: Oh no, the water is too dirty for fishing or swimming!
Local groups are doing water quality monitoring and could help the IDNR assess more water bodies. For example, Prairie Rivers of Iowa and our partners documented E. coli levels in Ioway Creek that were 18 times higher* than the standard! However, since our data was not collected under an IDNR-approved quality assurance plan (and since IDNR rarely approves such plans), the most they can do is put Ioway Creek on a list of “Waters in Need of Further Investigation” (WINOFI). If not for a state law (the Credible Data Law), the Impaired Waters List might be much longer and more worrisome.
*The South Skunk River between Story City and Ames is still on the Impaired Waters List because in 2014, the average (in this case, a geometric mean) E. coli count for the season was 223 colonies per 100mL, almost twice the primary recreation standard (126 colonies/100mL). In Ioway Creek in Ames, Prairie Rivers and our partners documented an E. coli geometric mean of 2,280 colonies/100mL in 2018.
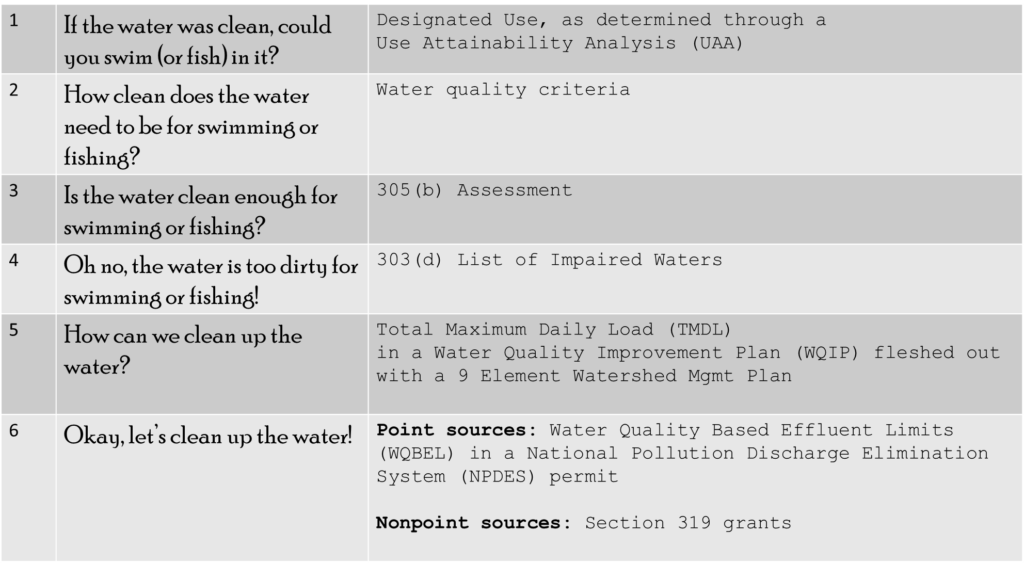
Step 5: How can we clean up the water?
The 303(d) list is not just an embarrassment for the state of Iowa. It’s also a waiting list for a water quality improvement plan. These plans are time-consuming to write, so the IDNR has to prioritize. Bacteria impairments in rivers are considered a lower priority, so the South Skunk River between Story City and Ames has been on the waiting list since 2004. It’s in good company: there are 594 stream segments, lakes, and wetlands that need a Total Maximum Daily Load (TMDL).
Step 6: Let’s clean up the water!
Some lakes and rivers have water quality improvement plans that were written over a decade ago and haven’t been implemented. I’ve read a few. In the case of the Little Wall Lake plan (2005), the report did not offer any good solutions, and maybe there aren’t any–it’s a shallow lake with a lot of phosphorus in the muck that gets stirred up when it’s windy. In the case of the Raccoon River plan (2008), solutions are recommended, but there are many obstacles to implementing them: both social (many farmers don’t want to) and legal (the Clean Water Act can’t make them).
Iowa Department of Natural Resources Attention: IR Comments Water Quality Monitoring & Assessment Section Wallace State Office Building 502 East 9th Street Des Moines, IA 50319
As I’ve said, we think the Impaired Waters List represents a missed opportunity to communicate with the public about threats and opportunities to recreation and fisheries in Iowa waters. We would welcome a discussion about how this gap could be filled.
Later this month, we are releasing a report with the findings from Story County’s 2021 water monitoring season.
In some ways, 2021 was an unlucky year to launch a water quality monitoring program. Story County was in drought conditions for much of the year, and smaller streams were frequently dry when we did our monitoring routes.
In some ways, it was an ideal year to launch a monitoring program, because weather always has an influence of water quality and the challenging conditions in 2021 forced us to better account for it.
For the report, this means asking a simple question: “was there enough water to float a canoe on the day you sampled?”
When the South Skunk River is too low for paddling:
Not much water (and not much nitrogen and phosphorus) reaches the Gulf
“Hot spots” for nitrogen and phosphorus are below wastewater treatment plants
When the South Skunk River rises high enough for paddling:
“Hot spots” for nitrogen are in the Headwaters of the South Skunk River Watershed upstream of Ames, as shown in the graph
E. coli levels upstream of Ames (and Ioway Creek) get worse but still meet the standard
E. coli levels downstream of Ames (and Ioway Creek) get better, but still exceed the standard
If I had less curiosity and more sense, I would have written a short report: “great job everyone! We collected a lot of data. Here it is! It’s possible that drought had an influence on water quality.” This was more work, but I hope you get more out of it.
Last month marked the departure of our pollinator and native plant expert David Stein as he heads back to work in his home state, our neighbors to the north, Minnesota. We are missing his passion and work ethic, but our Watersheds and Wildlife program continues as always and efforts are well underway to find his replacement.
David contributed to a large part of Prairie Rivers of Iowa’s continued efforts to impact public awareness and implementation of conservation practices to create native plant, pollinator and wildlife habitat to help improve soil and water quality while protecting the endangered rusty patched bumble bee and other species of greatest conservation need in Iowa. He was instrumental in creating a native seed bank and the development of many acres of habitat.
I recently visited with David as he reflected upon his work here at Prairie Rivers and his hopes for the future state of native habitat and pollinators in Iowa.
What do you feel was your biggest accomplishment while working at PRI? There are a lot! I think both completing the National Fish and Wildlife Foundation grant and setting the stage for PRI’s next series of habitat/conservation projects was probably the biggest accomplishment during my time here. On top of that, raising awareness of pollinator issues and educating interested landowners on how to install habitat was also a major highlight of my work. Re-discovering the rusty patched bumble bee, and mapping out new sightings was definitely a high point for me too.
How do you feel the health of native habitat and pollinators is currently in Iowa? What progress has been made? Where do we need to go from here? We have a long way to go, but I think we’re in a better place than we were a few years ago. Our outreach and education efforts, especially our work with counties, cities and landowners have definitely gotten the ball rolling, but a more hands-on-deck is always better. A coordinated conservation and restoration effort between non-profits, municipalities, farmers, landowners, homeowners, businesses, and interested individuals is really the best and only way forward to reverse pollinator and habitat decline.
What’s next for you? Next, I’ll be working up at the Minnesota Department of Natural Resources in St. Paul. I’ll be able to be involved in habitat projects all throughout the state and be able to meet with a bunch of different stakeholders that are doing some amazing restoration work.
How has working at PRI enriched your professional life? Working here has definitely enriched my professional life. I’ve been able to improve my own knowledge and passion regarding pollinator and wildlife conservation and directly apply it in real-time. I’ve also been able to connect and network with so many amazing stakeholders and partners from a variety of backgrounds. I know that I’ll be able to use these skills and lessons throughout my professional life moving forward.
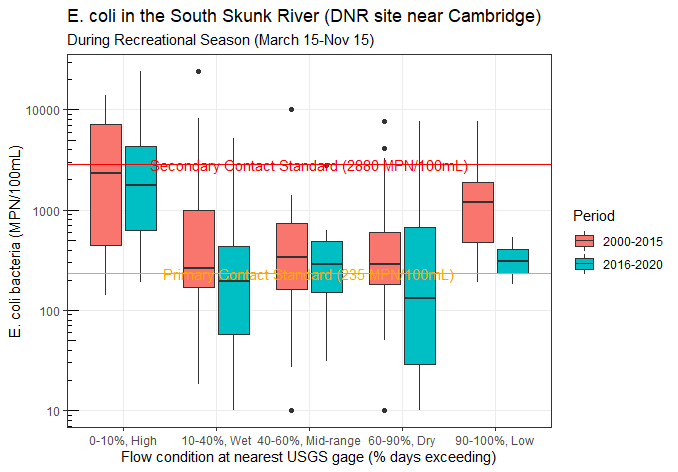
Water quality in the South Skunk River is still poor but has gotten better in the last five years. One reason for improvement is a new disinfection system at the Ames wastewater treatment plant.
Dr. Chris Jones recently shared a water quality index he developed for Iowa rivers, combining five important water quality metrics. Of the 45 sites in the Iowa DNR’s ambient monitoring network, the South Skunk River near Cambridge scored “poor” and ranked 34th overall. This site also has the 3rd highest phosphorus and the 5th highest E. coli levels.
A follow-up article looked whether the current (2016-2020) water quality index has changed from previous decades. Most rivers have stayed the same or gotten worse, but the South Skunk had a better score. Three of the metrics (total phosphorus, total nitrogen, and E. coli bacteria) improved, while one (turbidity, a measure of sediment in the water) got worse.
Phosphorus and muddy water usually go together, so this odd pattern demanded some explanation. I did my own analysis of the data, curious if the changes were happening under drier conditions (when wastewater has a bigger influence), wetter conditions (when agricultural runoff has a bigger influence) or both.
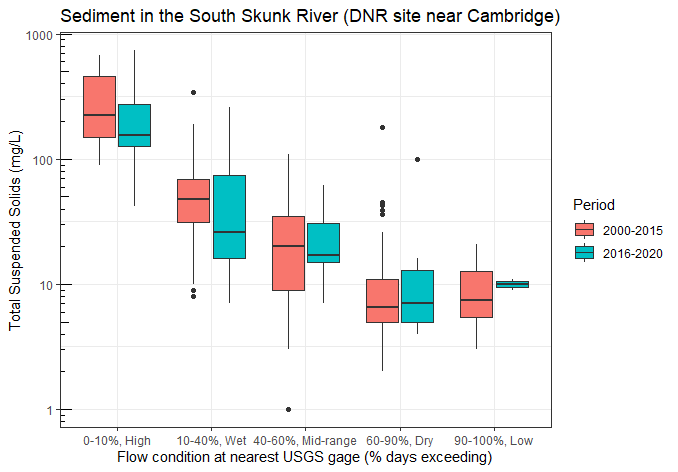
See last week’s post for an explanation of the flow categories I’m using. I use a lot of boxplots, which show both the central tendency and the spread of the data. The lower end, middle, and upper ends of the box are the 25th, 50th (median) and 75th percentiles. The “whiskers” show the maximum and minimum, unless they’re really far out there, in which case the “outliers” represented by dots. Water quality data never fits a bell curve, so lopsided boxes and outliers are to be expected.
It turns out that the river didn’t get any muddier (it got less muddy) when you compare wet conditions to wet conditions and mid-range conditions to mid-range conditions.
It’s just that the past five years were a little wetter and so a larger share (43% vs 29%) of the samples were collected during wet conditions when the river was moving swiftly and carrying more sediment. A smaller share (25% vs 42%) of the samples were collected during dry and low-flow conditions when the water is usually clear. That made the average sediment concentration increase.
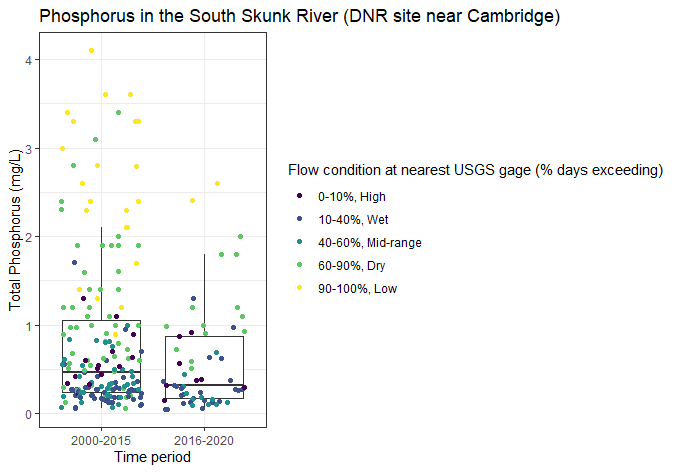
Weather also can explain trends in phosphorus. In the past five years, a smaller share of the samples were collected during dry and low-flow conditions when phosphorus concentrations are especially high. That made the average phosphorus concentration decrease.
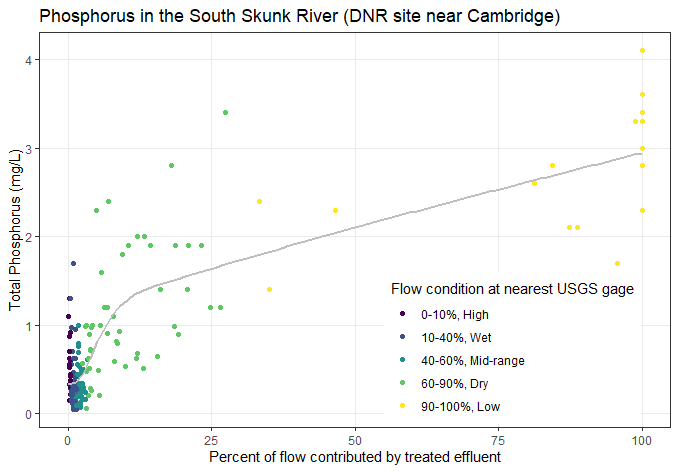
Why is phosphorus so high when it’s dry? The monitoring site in question is just below the outfall of Ames Water Pollution Control Facility on 280th St, about 4 miles north of Cambridge. This facility discharges over 6 million gallons a day of treated wastewater. When conditions are dry, the effluent is less diluted, and so phosphorus in the stream approaches phosphorus levels in the effluent (which averages 3.8 mg/L), as shown in the graph below. This year we’ve also monitored West Indian Creek below the Nevada wastewater treatment plant and have seen the same pattern.
Wastewater treatment plants are regulated to minimize the impact on receiving waters and the Ames WPC Facility has one of the best compliance records in the nation. However, while the treatment process is very good at removing ammonia, solids, and oxygen-depleting substances, the process is not that effective for removing nutrients.
The Iowa Nutrient Reduction Strategy is not voluntary for wastewater treatment plants. The Ames Water and Pollution Control Department commissioned a feasibility study as a condition of its permit, which determined that the facility could achieve a 67% reduction in total nitrogen and a 75% reduction in total phosphorus by replacing its trickling filters with an activated sludge treatment system. This new system will be phased in as the filters reach the end of their useful life (starting in 2027) and will cost $39.6 million.
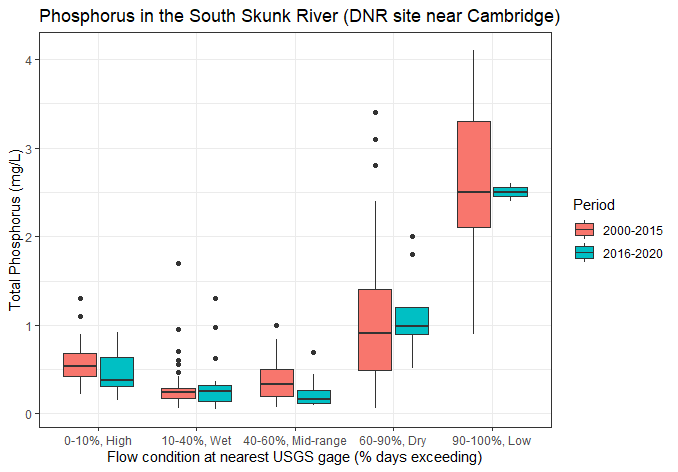
In the last five years we have not seen any reduction in phosphorus during dry and low-flow conditions when wastewater treatment systems have the biggest influence. However, there was a reduction in phosphorus* under mid-range and high flow conditions! This is really interesting–I’ll have to look at some other data sets to see whether it holds up and whether we can link it to conservation practices in the watershed.
For E. coli, we see improvement across all conditions, with the largest improvement during low-flow conditions* when wastewater has the biggest influence.
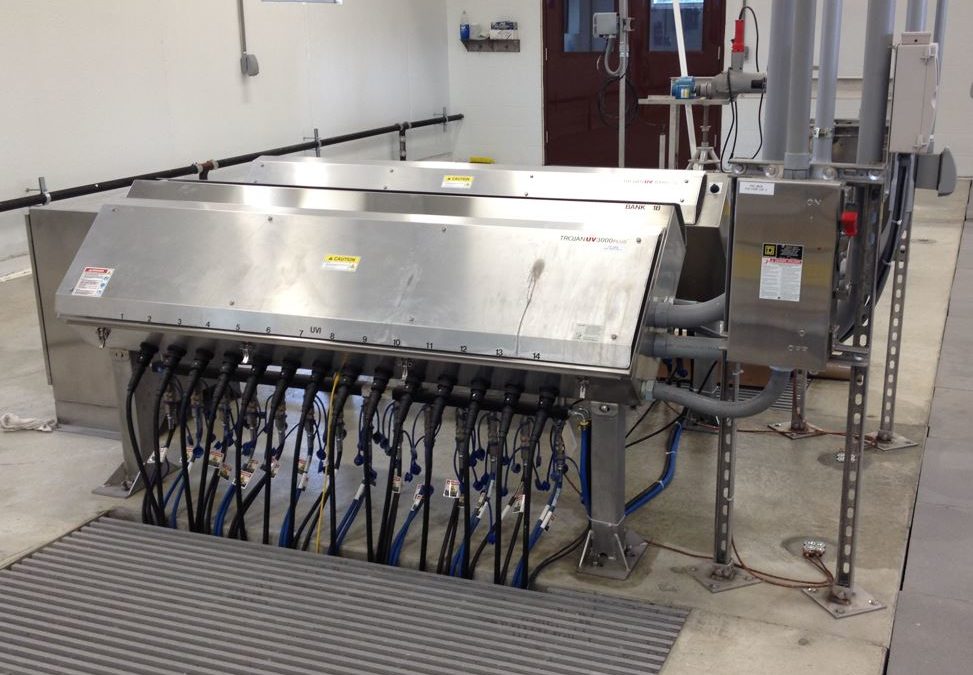
The effluent discharged to the river has gotten a lot cleaner since the Ames Water Pollution Control Facility built $2 million disinfection system using ultra-violet (UV) light. The system was completed in March of 2015. During the recreational season (March 15-Nov 15), treated effluent passes through two banks of lights that kill microbes. Prior to this, some E. coli and pathogens could make it through the system and end up in the river. Chlorination, a good solution for disinfecting drinking water and swimming pools, is not ideal for wastewater because it can harm fish.
Kris Evans, an environmental engineer for the City of Ames and the project manager, said this about the system:
“By using UV we continue to be “chemical free” for treatment of the wastewater and it’s much safer for staff since they don’t have to chlorinate and dechlorinate. When flow is low at the plant, we are able to lower the intensity of the bulbs to save energy and still meet permit limits; as flow increases so does the UV light intensity. The City started design of the UV system before it was mandated in a permit; we knew it was coming, but wanted to be proactive in the treatment of water, making it safer for those who recreated in the river. It was also the first project the department funded through an State Revolving Fund (SRF) loan.”
We still see high E. coli levels in other streams that receive effluent, but smaller wastewater treatment systems are also making the switch to comply with new permit requirements. In Story County, Gilbert added a UV disinfection system in 2019, the Squaw Valley HOA completed theirs in 2020, and Nevada will build a new wastewater treatment plant in 2022 that includes UV disinfection.
* I’ve written before about the challenges of detecting water quality trends. I’m pleased to report that two of the trends discussed here (a reduction in phosphorus at mid-range flow conditions, and a reduction in E. coli in dry and low-flow conditions) were statistically significant at 90% confidence level, using a test of the difference between medians. The approach employed here (sorting by flow conditions) may be a good way to control for weather and reach more reliable conclusions. It’s exciting to have some good news that holds up to further analysis!
 .
.