The Legacy of the IOWATER Program

The Legacy of the IOWATER Program

For 18 years, staff with the Iowa Department of Natural Resources trained and equipped volunteers to test water quality in rivers and streams across the state, building a network of citizen scientists and conservation leaders in the process.  The IOWATER program died in 2016 after a long battle with budget cuts, declining participation, and IT challenges. It is survived by the state’s largest river cleanup event (Iowa Project A.W.A.R.E.) and many volunteers who resumed or started monitoring with the support of the Izaak Walton League, county conservation departments, watershed coalitions, and local non-profits. 

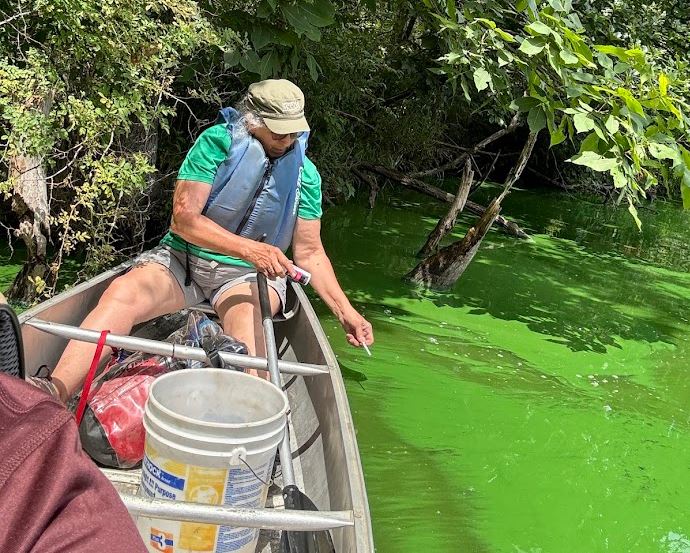
Laura Merrick tests nitrate in the green waters of Lake Darling

The first Iowa Water Summit in 2019 was a sort of a funeral for the IOWATER program and a passing of the torch to the Izaak Walton League’s Save Our Streams program.  Several groups in Iowa are making good use of the Ikes’ online database, trainers and training materials, and extra supplies.  However, stream monitoring in the post-IOWATER era is decentralized and locally-led.  Prairie Rivers of Iowa thought we could all benefit from more collaboration, so we wrote a grant proposal that was funded by the Water Foundation.  Over the past year, I’ve been meeting regularly with colleagues from the Iowa Environmental Council, Northeast Iowa RC&D, Pathfinders RC&D, Partners of Scott County Watersheds, Polk County Conservation, and Drake University to talk about water monitoring, lay the groundwork for some new tools, and help the Izaak Walton League plan a second Water Summit.

Register for the Iowa Water Summit

The second Iowa Water Summit (scheduled for Oct 8 in Des Moines) is an opportunity for anyone involved in a local monitoring program (or looking to start one) to come together and learn from the experience of others around the state.  We’ll have time and space for displays and networking.  We’ll have a panel about recruiting and retaining volunteers.  We’ll have a talk about making sense of the data once you have it, and another about new methods like microbial source tracking.  We’ll have a panel about communicating with the public and turning data into action.  If you’re at all interested in water quality and water monitoring in Iowa, don’t be shy!  Register before September 20!

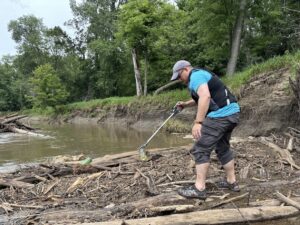
A Project AWARE volunteer balances on a log jam to retrieve trash.

The other legacy of IOWATER is less trash in our rivers.  Iowa Project A.W.A.R.E. was started in 2003 by IOWATER coordinator Brian Soenen, who now serves on the board of a non-profit that continues the tradition. This year, 269 volunteers in canoes removed and recycled 3.8 tons of trash from 60.2 miles of the Skunk River.  

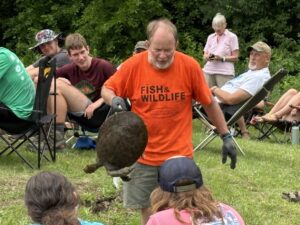
Denny Weiss handles a softshell turtle for a Project AWARE nature program.

This was my first year participating in the cleanup and I highly recommend it!  In addition to the fun of being on the water and the satisfaction of leaving the river cleaner than you found it, I enjoyed good food, friendly people, and interesting evening nature programs, including live turtles and a dugout canoe!

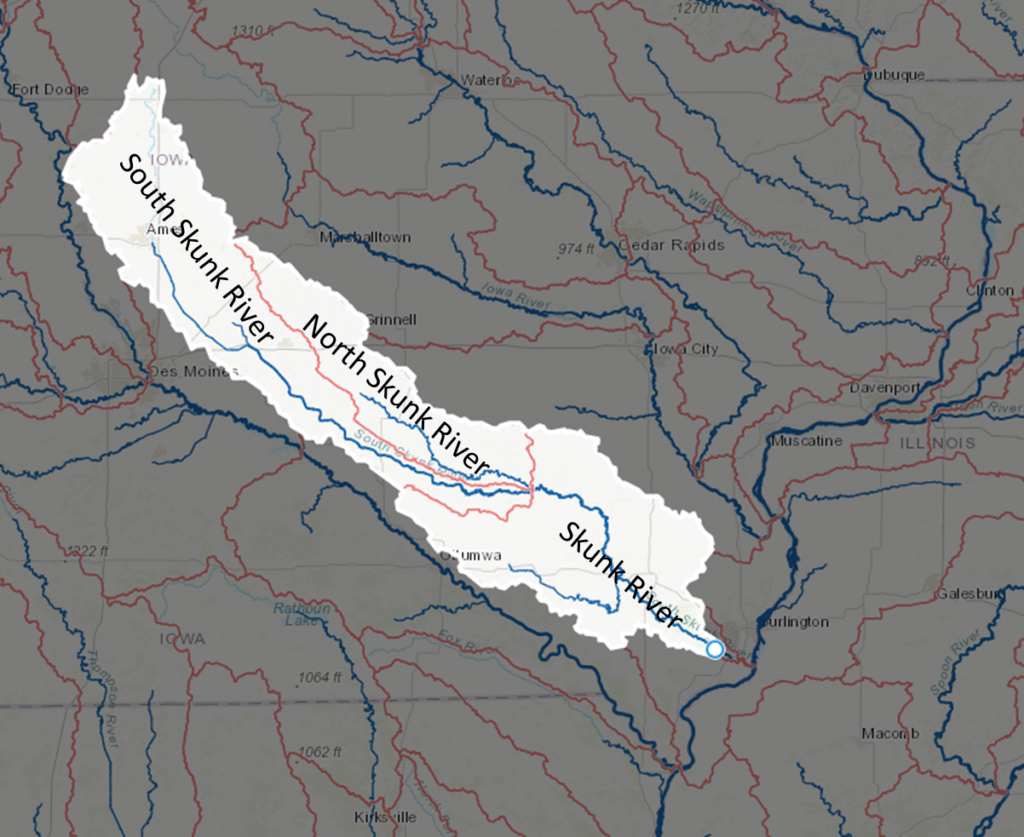
Skunk River watershed map

 A.W.A.R.E. stands for A Watershed Awareness River Experience, and I tried to raise some watershed awareness in my Monday afternoon talk about the hydrology and water quality of the Skunk River.  For example:

  • The Skunk River starts near Blairsburg and joins the Mississippi River near Burlington after a journey of 274 miles.  By that point, it drains more than 4000 square miles of central and southeastern Iowa.
  • Thunderstorms in the Ames area lead to a rise in water levels at Augusta eight days later.
  • Rain that falls in the watershed can reach streams quickly if it runs off the surface or travels through storm sewers or drainage tiles, but moves more slowly if it’s caught by ponds and wetlands or soaks into the ground.  Some of the water entering Ada Hayden Lake in Ames showed chemical signatures of having been underground for more than 50 years!

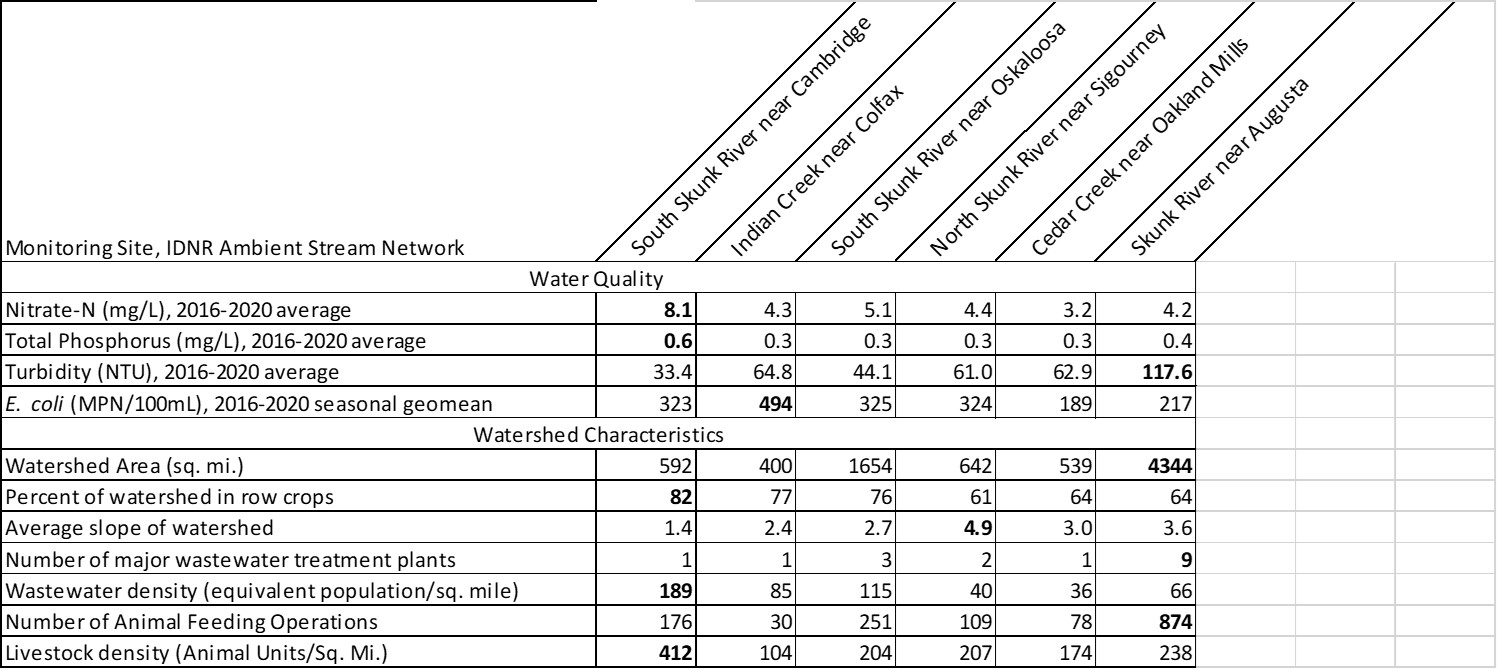
Watershed characteristics can help explain water quality patterns in the Skunk River and its tributaries, as shown in this table.  For example:

  • The North Skunk River watershed has steeper hills, so has higher turbidity levels.  The South Skunk River watershed is flatter with more tile-drained cropland, so has higher nitrate.
  • The Skunk River receives effluent from 9 major wastewater treatment plants (Ames, Newton, Nevada, Mt. Pleasant, Grinnell, Fairfield, Oskaloosa, Washington and Montezuma) and 85 smaller systems, which contribute to higher phosphorus levels.
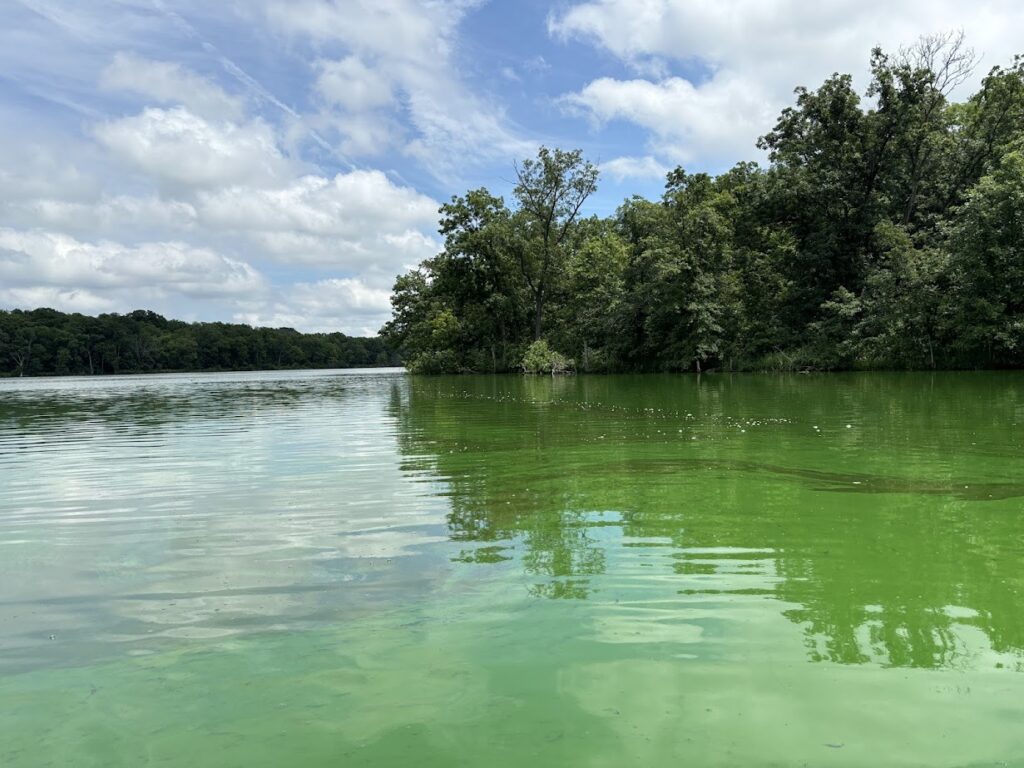
Cyanobacteria bloom in Lake Darling, July 2024

However, the most memorable and sobering lesson about watersheds was taught by Lake Darling.  We camped three nights at the state park, and I had an opportunity to explore it on Monday when high water levels kept us off the river.  Lake Darling State Park has a lot going for it: a large lake in a beautiful setting, with an active Friends group that has improved trails and facilities.  But the water quality is appalling.  During my visit, the beach had a warning sign posted due to high levels of microcystin (a toxin produced by blue-green algae).  I have never seen water this green.  It looked like a kale smoothie and smelled like manure. 

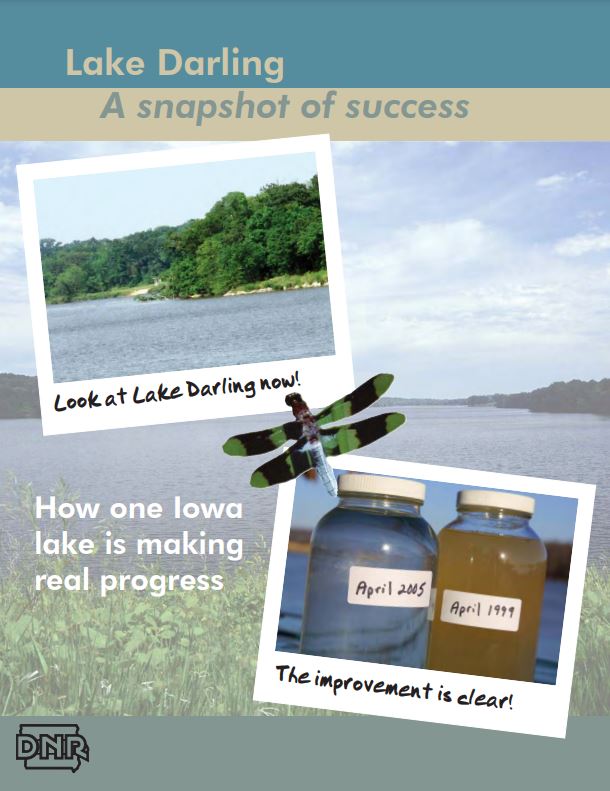
"Lake Darling: A Snapshot of Success"

What happened?  In 2007, Iowa DNR was celebrating Lake Darling as a success story, after most farmers in the watershed participated in a program to control erosion and intercept runoff.  A $12 million project to drain and restore the lake was completed in 2014.  By every indication, these efforts were successful at reducing the amount of sediment entering the lake. However, other water quality metrics (orthophosphate, E. coli, and microcystin) have gotten worse.  The most likely explanation is the manure from 30,000 hogs.  Nine animal feeding operations have been built in this watershed since the park reopened.  I calculated the density of livestock in Lake Darling’s watershed (598 animal units per square mile) and found that it’s highest of any lake in Iowa, and higher than all but a handful of rivers. 

This is why it’s not enough to measure success by dollars of cost share spent or the number of practices installed.  We need to be aware of both positive and negative influences on the water bodies that we care about, and we need to test whether water quality is actually improving.  At the Iowa Water Summit, I’ll share some tools and tips for doing just that.  Hope to see you there!

Five Stages of Watershed Awareness

Five Stages of Watershed Awareness

October is Watershed Awareness Month, by proclamation of Story County Conservation Board and city councils in Ames, Nevada, and Gilbert. Okay, so what exactly do we want people to be aware of? I would suggest the following progression…

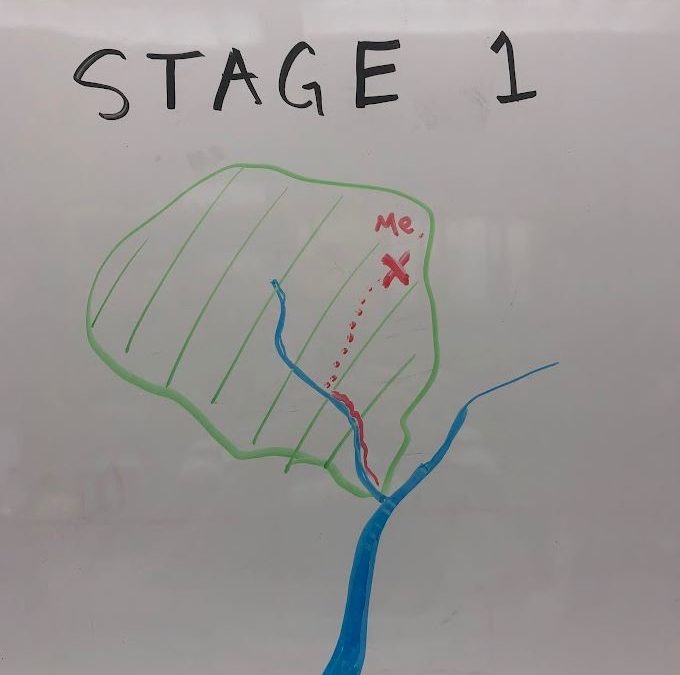
Stage 1 of watershed awareness

Stage 1: What’s a watershed?  Who cares?

A watershed is the land area that drains to a common outlet. Imagine a river valley between two mountain ridges. Now replace that mental image with gentle hills–we’re in Iowa. But more important than knowing the definition is understanding why it’s important: because water flows downhill, actions on land can have consequences for downstream water bodies.

Perhaps the best illustration of this principle is an incident from 2020. Following a power outage, some Hy-Vee employees in Ankeny poured 800 gallons of spoiled milk down a storm sewer, turning the nearby creek white, killing 2,000 fish, and costing their employer almost $25,000 in fines and restitution. The silver lining of this boneheaded decision was that it made the news and reminded many Iowans that yes, storm sewers drain to rivers (usually without any treatment) and so we should think twice about what we pour or let wash in. The same principle applies to ditches, gullies, and drainage tiles.

Want a more positive framing? Watch this one-minute video we created with the City of Ames about the South Skunk River, and how cities and farms in the watershed can make a difference.

Stage 2 of watershed awareness.

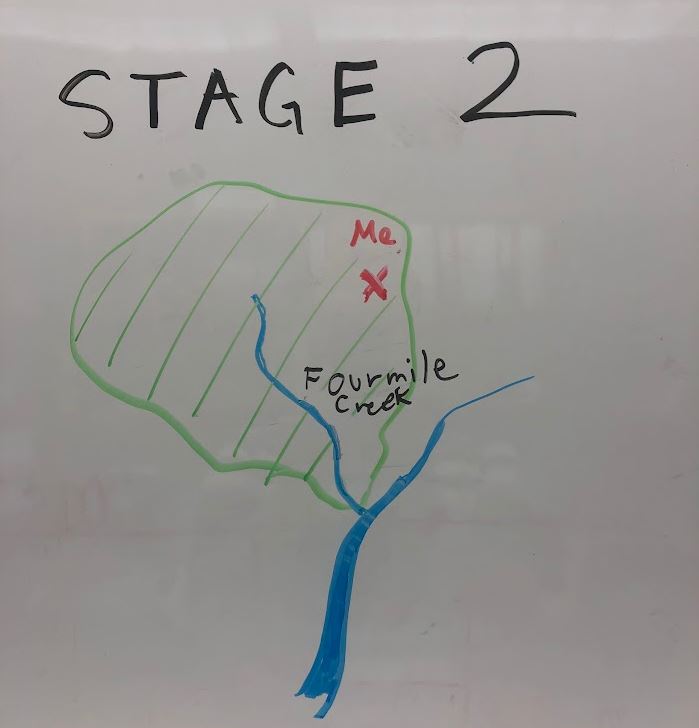
 Stage 2: What’s my watershed(s)?

It’s one thing to know that my actions could (in principle) help or harm some downstream water body. It’s another thing to know that what goes down my neighborhood storm drain ends up in Ioway Creek at Brookside Park, a place where I’ve taken my kids to play. In 2018, we partnered with Story County Conservation to put up watershed and creek signs, in hopes that more people make those kinds of connections.

Creeks flow to rivers and rivers flow to the sea (except in endorheic basins) so we live in multiple, nested watersheds.  A convenient way to represent this is with the US Geologic Survey’s Watershed Boundary Dataset, which has mapped American watersheds at six levels and assigned them each a unique hydrologic unit code (HUC).  You can look up your “watershed address” with our interactive map.  For example, that grocery store in Ankeny is in the lower Fourmile Creek watershed, within the watershed of Red Rock Lake, within the watershed of the Des Moines River, and within the upper part of the giant Mississippi River basin.

Watershed awareness, stage 3

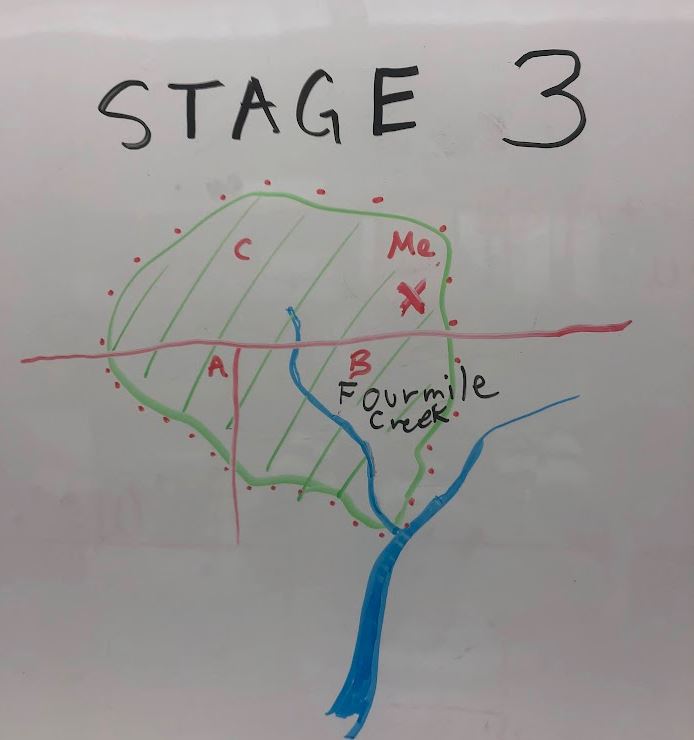
Stage 3: Who are the other people in my watershed?

One reason to learn which watershed you live in is to connect with other people who are concerned with flooding, water quality, fisheries, and recreation.

Twenty-eight watersheds in Iowa have a Watershed Management Authority with representatives from local governments in the watershed (cities, counties, and soil and water conservation districts) who might collaborate on water quality or flood control projects.  Fourmile Creek WMA is one of the more active WMAs; its member jurisdictions pooled money to hire a watershed coordinator who can work with farmers and landowners.  In some watersheds, farmers and landowners have access to additional cost-share programs or receive higher priority when they apply.

In some watersheds, a volunteer group, land trust, or other non-profit organization organizes projects to protect the water or raise public awareness.  For example, the lake at Ada Hayden Heritage Park in Ames has a friends group, while the Raccoon River has a volunteer Watershed Association in addition to three WMAs.

Caveat

Unfortunately, I’m not aware of any central clearing house where one can find out what groups and projects are active in your watershed. I’m also not aware of any plans by state leaders to provide WMAs with stable funding or to delegate to them any powers that would help them accomplish their tasks. Watershed projects tend to be grant-funded (and thus short-lived) and watershed coordinator jobs often have high turnover.

Stage 4 of watershed awareness

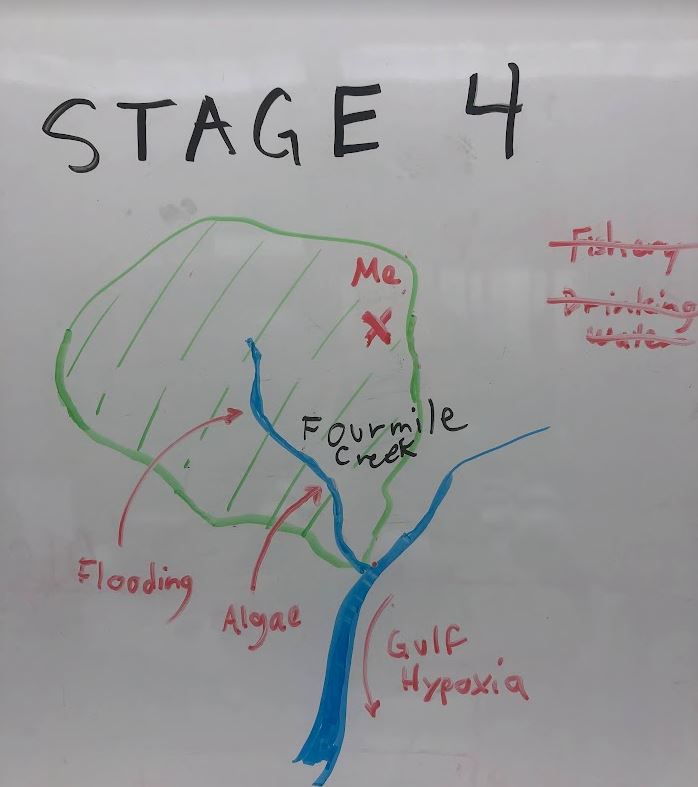
Stage 4: What are the issues in my watershed?

Some watersheds have management plans (like this one for Fourmile Creek) that identify creek- or lake-specific problems and solutions. However, in many cases, the data needed to evaluate a problem and track progress toward solutions is missing until volunteers, universities or local government step up to do monitoring.

Knowing which issues go with which watershed can help us prioritize and find solutions.

  • Not every stream has the right conditions to support a trout fishery (like Bloody Run in Clayton County).
  • Not every stream has a history of destructive floods (like Fourmile Creek in Polk County).
  • Not every lake or reservoir has suffered from toxic algae blooms (like Brushy Creek Lake in Webster County).
  • Not every river is deep enough and has access for canoeing (like the South Skunk River in Story County).
  • Not every river affects the supply and safety of drinking water for thousands of people (like the Raccoon and Cedar rivers).
Stage 5 of watershed awareness

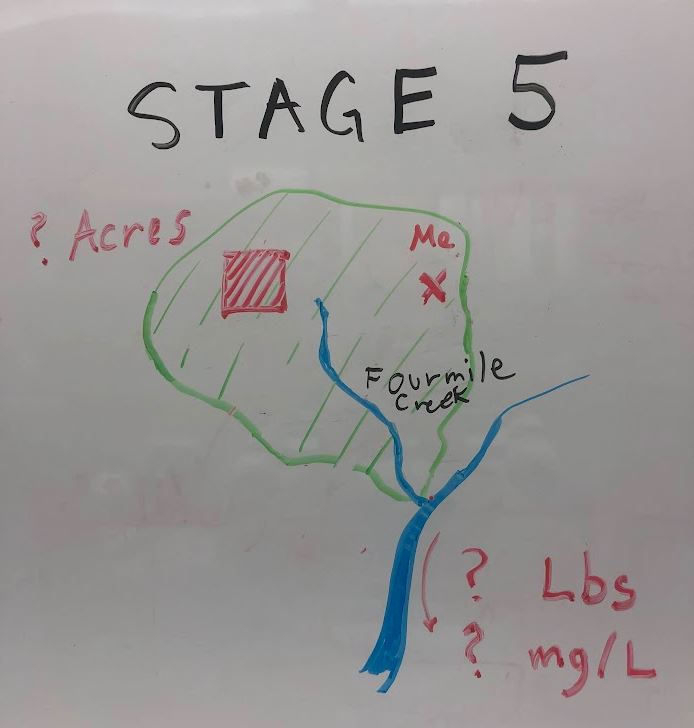
Stage 5: How big are the problems and solutions in my watershed?

The most difficult thing to understand about a watershed is the scale.  It helps to have some familiar reference points.  Here are some of mine.  (I’ve used an app that makes it easy to delineate a watershed for any point of interest.  The area is rounded to the nearest 100 acres.)

  • 1,000 acres: Creek at Tedeco Environmental Learning Corridor, Ames.
  • 5,900 acres: Peas Creek at the Ledges State Park.

At the HUC12 scale, most creeks are too wide to jump across, but shallow enough to wade.  Watersheds are small enough to fit in one county.

  • 14,100 acres: Walnut Creek at Neil Smith National Wildlife Refuge
  • 24,000 acres: Bloody Run at Marquette.
  • 56,800 acres: Fourmile Creek at Sargent Park in Des Moines.

At the HUC10 scale, it might be called a creek, but it often has enough water to float a canoe, and watersheds usually cross a few county and city lines.

  • 132,700 acres: Ioway Creek at Brookside Park in Ames.
  • 173,500 acres: Maquoketa River at Manchester.
  • 209,300 acres: South Skunk River at River Valley Park in Ames.
  • 356,100 acres: Rathbun Lake

At the HUC8 scale and beyond, the rivers are big and the watershed meetings can involve many jurisdictions and long drives.

  • 586,400 acres: Floyd River at Sioux City
  • 1,285,200 acres: North Raccoon River at Squirrel Hollow Park in Jefferson
  • 2,306,200 acres: Racoon River at Waterworks Park, Des Moines
  • 3,733,300 acres: Des Moines River at Saylorville Reservoir
  • 97,191,700 acres: Mississippi River at Dubuque

For each of these watersheds, you’d need to plant about a third of the cropland to cover crops to reduce nitrogen and phosphorus in the stream by 10%.  Most watershed plans will include more ambitious long-term goals and more complicated scenarios to achieve them, but this is a handy benchmark for thinking about the scale of change needed.  Reaching the 1/3 mark for cover crops in a watershed would be good progress toward our 45% nutrient reduction goals and could produce a big enough improvement in water quality in the stream that we could conceivably measure it, though maybe not with test strips (i.e. from 10 to 9 mg/L of nitrate, from 0.40 to 0.36 mg/L of total phosphorus).

I don’t mean to discourage anyone, but I’m not aware of any watershed project in Iowa that has achieved success on this scale.

Think Outside the HUCs

Think Outside the HUCs

“With the Nutrient Reduction Strategy approaching its 10-year anniversary in 2023, Iowans deserve to see water quality results from the nearly $100 million of public money invested since 2013.  Water monitoring is a crucial component to the success of the Nutrient Reduction Strategy and must be designed to assess progress.  A strategy without a way to evaluate progress or outcomes is not a real strategy.”

– from Iowa Environmental Council’s 2022 report:  “Water Quality Monitoring and the Water Quality Initiative

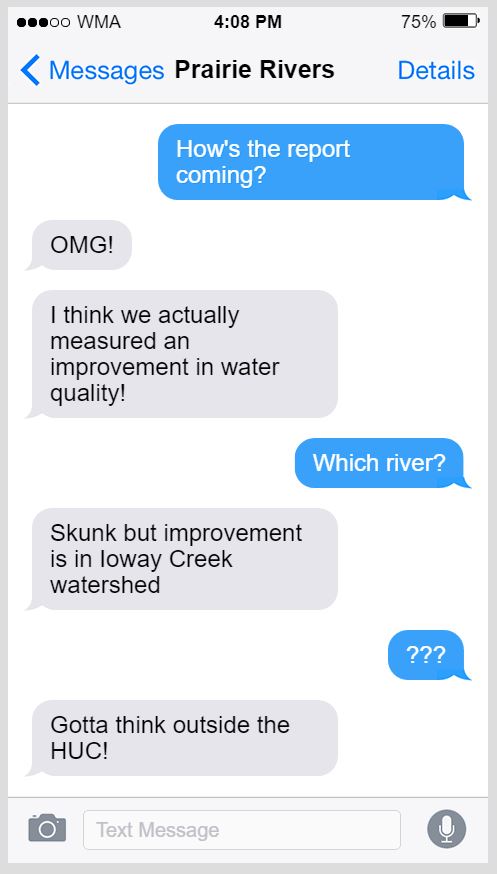
fake text message to introduce blog post

Most water monitoring programs are NOT designed to assess progress.  Often, people don’t begin monitoring in earnest until the grant funding arrives for an improvement project (or on flip side, until an industry with a reputation for pollution sets up shop in the area).  Often, they’re hoping for preliminary results when the grant wraps in 3-5 years.  I’ve been down that road, completed a horrifying statistical analysis, and left this conference poster as a warning to others: “Progress tracking is not a realistic use for typical stream monitoring approaches”.

Our local partners in Story County took this warning to heart and made a plan to sustain water monitoring for at least ten years, while shifting our focus.  We collected lab samples from more sites (less often, and with less hassle) while ramping up the volunteer program, so we could engage the public and get a baseline understanding of water bodies all around the county.  All is well and good.  But now and then I come back to the question “how would you monitor water if you were serious about assessing progress?”.

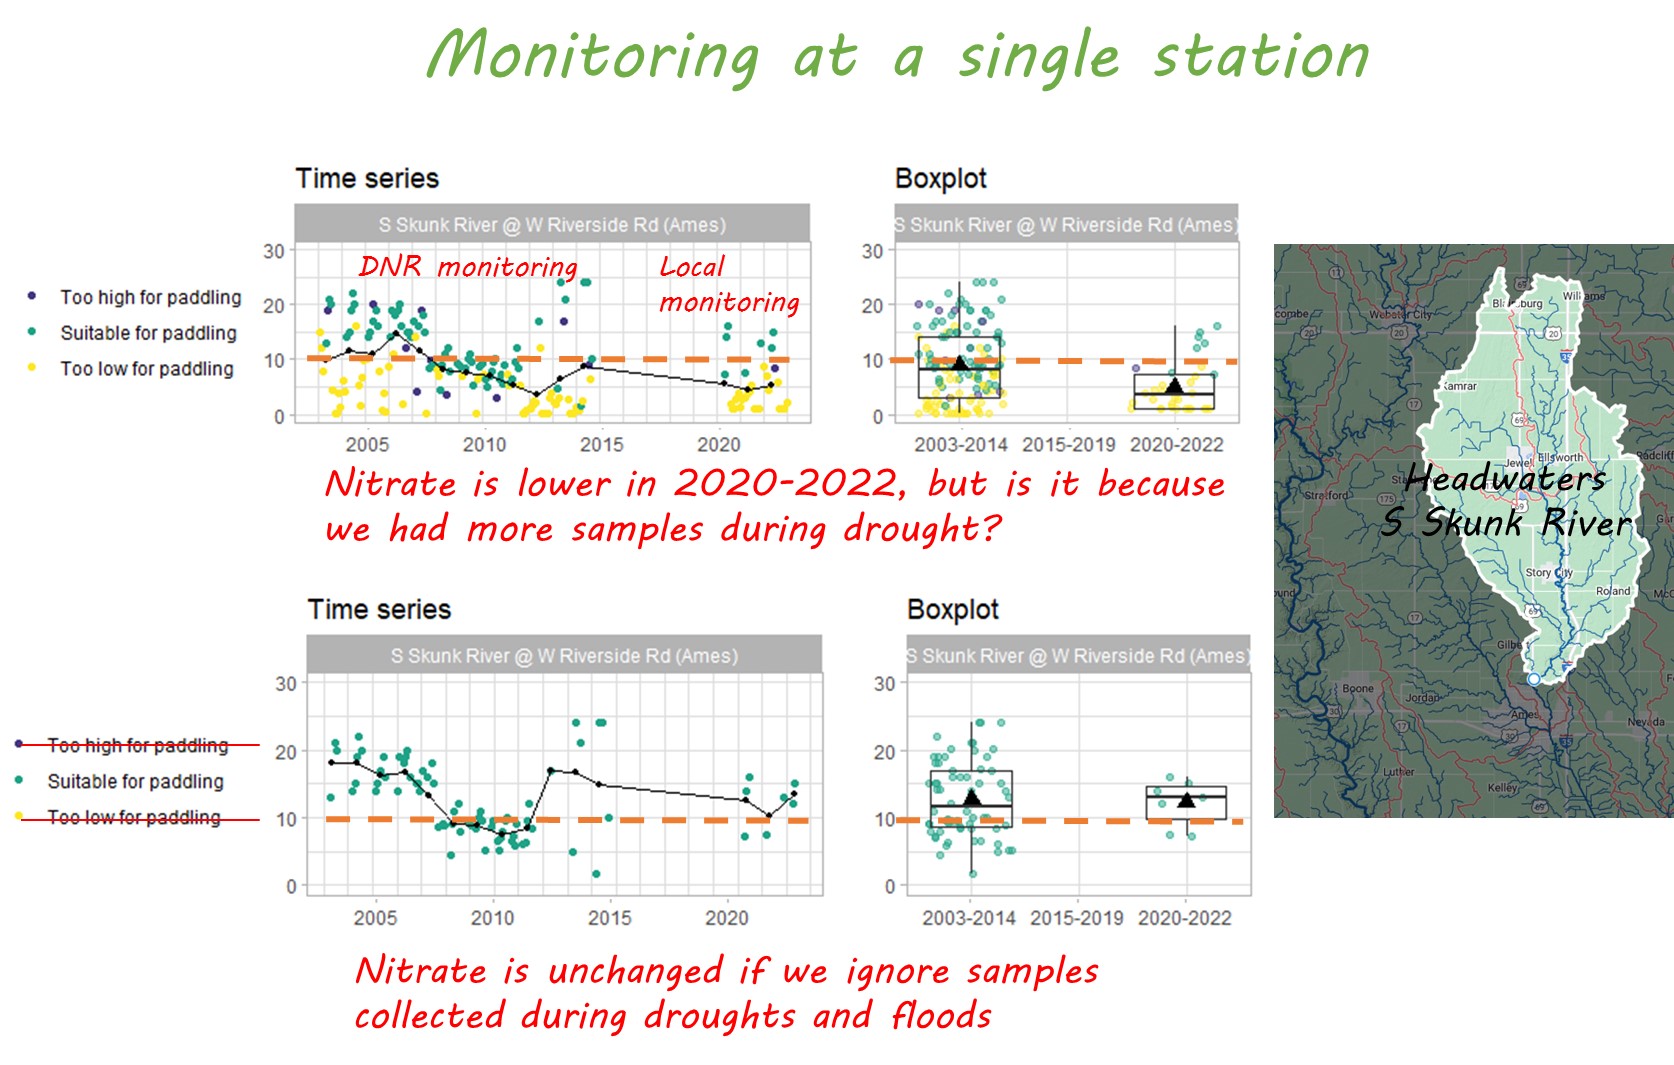
Preliminary results in 3-5 years might be feasible if you already have baseline data for comparison, and account for any big changes in weather.  The South Skunk River just upstream of Ames was monitored from 2001-2014 by the Iowa DNR, and we resumed monitoring it in 2020.  I have good news and bad news for the newly formed Headwaters of the South Skunk River WMA.

  • Good news: average nitrate concentrations over the last three years have declined 46% compared to the baseline period.  Mission accomplished?
  • Bad news: the trend goes away if you exclude samples collected during a drought when nitrate levels are at their lowest.
nitrate trend in south skunk river above Ames

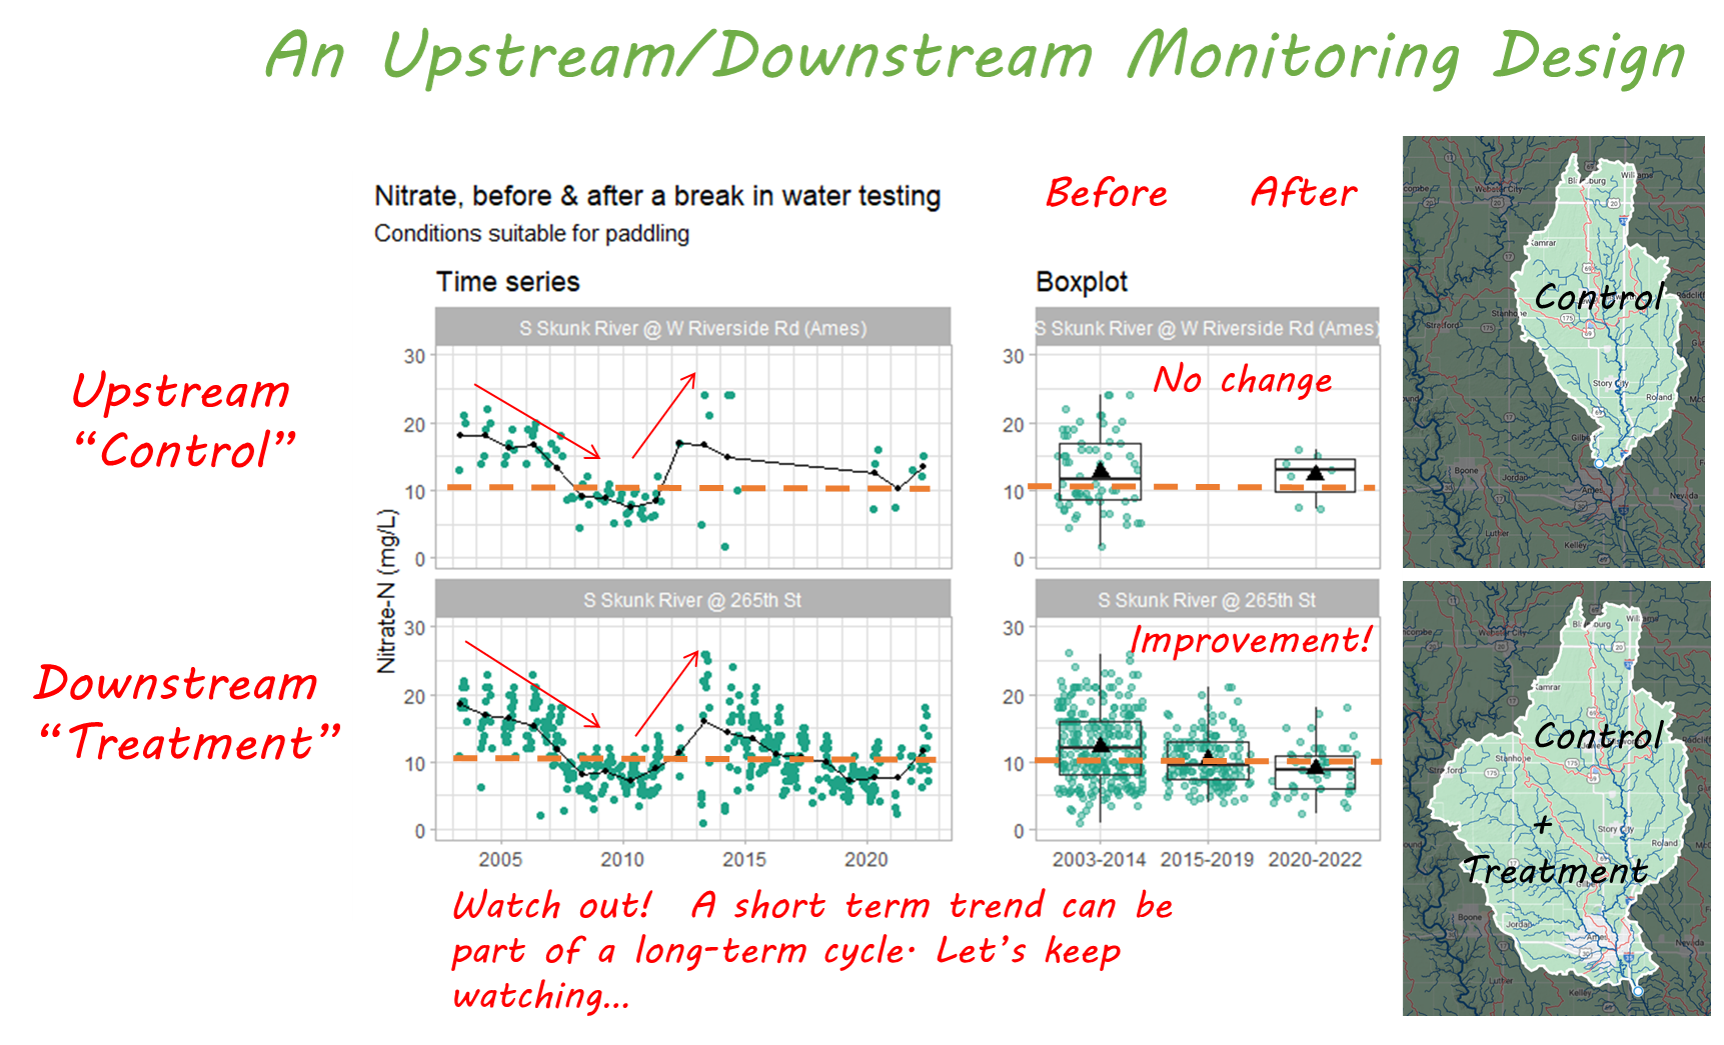
Study design is key for progress tracking.  In order to be sure that water quality really changed, and to be able to link that change to something that happened in the watershed, scientists approach water monitoring like a medical trial.  To do it right, there should be a treatment group (a watershed that receives conservation funding and attention), a control group (a nearby watershed that doesn’t receive funding), a before period, and an after period.  There should be a full accounting of land management and conservation practices in both watersheds.  If the treatment group improves more than the control group, that’s a good sign the medicine works.  At the time we wrote the Story County Monitoring Plan, doing a paired watershed study of the sort that Michelle Soupir did for Black Hawk Lake didn’t make a lot of sense.

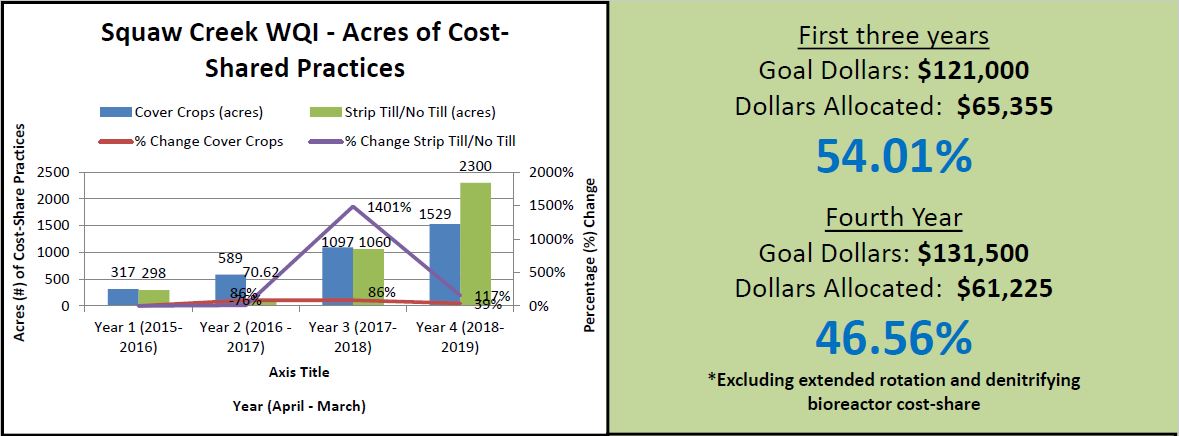
It didn’t make sense to invest in progress tracking, because our WQI-funded watershed project had come to a close, further funding was uncertain, and we couldn’t expect much improvement in water quality based on other metrics to date.  Our watershed coordinators worked really hard, we had enthusiastic partners in local government and agribusiness, and we organized some well-attended field days where we heard from inspiring early adopters of cover crops and bioreactors.  We met some farmers in the watershed who cared enough about soil and water to take a risk and try something new.  Unfortunately, at the end of four years, we had a lot of unspent cost share funds and only enough conservation practices to expect or 1 or 2 percent reduction in nitrogen and phosphorus.  Ioway Creek is a big watershed (147,000 acres).

metrics from wqi project

However, this year I was reviewing our water monitoring data and had one of those moments like when you squint at an optical illusion and suddenly see a rabbit instead of a duck.

“Hey, that looks a lot like an upstream/downstream study for tracking whether projects in the Ioway Creek watershed and the City of Ames have improved water quality!”

  • The medicine: A bunch of conservation practices were installed between 2015 and 2019, some of which address nitrogen and some of which address other pollutants. We could include Jean’s no-till fields in Hamilton County, Jeremy’s cover crops in Boone County, Gerold’s bioreactor in Boone County, the UV disinfection system in Gilbert, the permeable parking lot at Ames City Hall, the stream restoration and saturated buffer at the Tedesco Environmental Learning Corridor, and many others.
  • The treatment group: A downstream site, influenced by all those conservation practices. The South Skunk River at 265th St. has been monitored weekly by the City of Ames since 2003.  At this point the river drains 573 square miles, corresponding to the Ioway Creek watershed plus the Headwaters of the South Skunk River watershed.
  • The control group: An upstream site, not influenced by these practices. At this point, the river drains 316 square miles, corresponding to the Headwaters of the South Skunk River watershed, minus any land within Ames city limits.
  • A before period: Both sites were monitored between 2003 and 2014.
  • An after period: Both sites were monitored between 2020 and 2022.

And then I made a boxplot and squinted a little more and said, “Hey, it looks a lot like nitrate has improved at the downstream site!”  Same thing for E. coli!  Maybe there’s more to this story than just cost-share metrics.

graphs comparing nitrate at upstream and downstream sites

The analysis is described in more detail in our 2022 annual report on water monitoring in Story County.  We’ll also have some opportunities this year to talk with other groups around the state that are doing water quality monitoring and swap some tips and tricks.

Here’s one of mine. To see the “rabbit” in this data, you have to be flexible in how you think about watersheds.  A watershed is just the land area that drains to a common point.  With the right tools, we can delineate a watershed for any point of interest on the river network.  I’ve taught several classes of ninth graders how to do this.  Neither of these sites are in the Ioway Creek watershed, and they aren’t mentioned in the Watershed Plan, but that doesn’t mean they’re not relevant.  The US Geologic Survey’s system for mapping and numbering watersheds is convenient for many purposes.  But if you have access to long-term monitoring data, don’t be afraid to think outside the HUCs!

The Real Meaning of WOTUS

The Real Meaning of WOTUS

Last week at the Iowa Water Conference, I attended several sessions that illustrated of the consequences of paving over wetlands and streams.

This week, the Supreme Court is revisiting the question of which wetlands and streams are subject to the jurisdiction of federal agencies–another chapter in the Waters of the United States (WOTUS) controversy. The importance of this legal back and forth for agriculture and water quality has been greatly exaggerated. In practice, the definitions haven’t changed much and it mostly concerns Section 404 of the Clean Water Act: if your construction project involves running a bulldozer or backhoe in a stream or wetland, do you need to get a permit from the US Army Corps of Engineers?

UPDATE: The court’s decision on Sackett v. EPA was released in May of 2023.  We discussed the ruling and shared some illuminating passages from the legal opinions in this post.

Prairie Rivers of Iowa generally avoids getting mixed up in politics and policy, but maybe I can shed some light on what’s at stake and what isn’t.  Last week I was at the Iowa Water Conference with colleagues from Story County and the City of Ames to give a presentation on our locally-led water monitoring program. While at the conference, I attended several sessions that illustrated of the consequences of paving over wetlands and streams. Shout out to Michael Jansen of Strand Associates, Steve Brown from the City of Dubuque, and Tim Olson and Ryan Benjederdes of Bolton & Menck for sharing their projects.

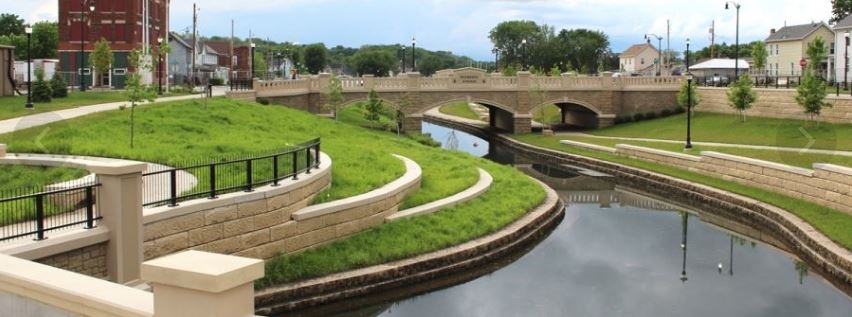
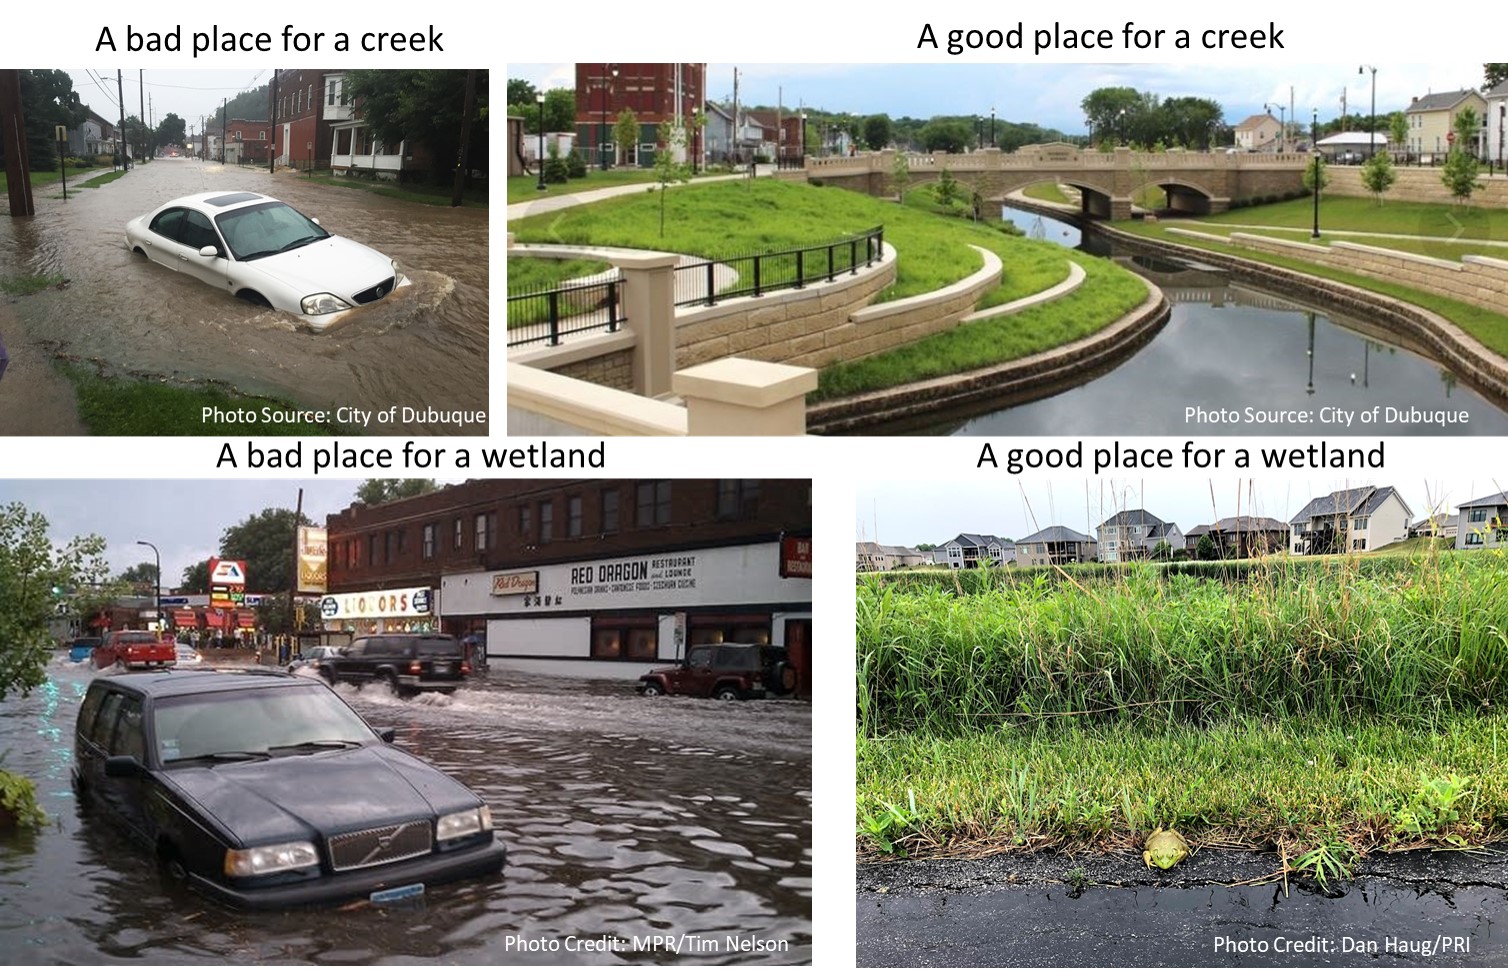
In Dubuque, a creek called Bee Branch had been put into a pipe to build a business district and a residential neighborhood, but had the habit of backing up into the streets and basements whenever the Mississippi River was high and there was a summer downpour. What used to be the 100 year storm is now the 50 year storm, so the complaints from residents were getting louder and more frequent. The solution was to daylight the creek and turn it into an amenity. The Bee Branch Greenway is beautiful and very thoughtfully designed, but it took a decade to build and cost $250 million.

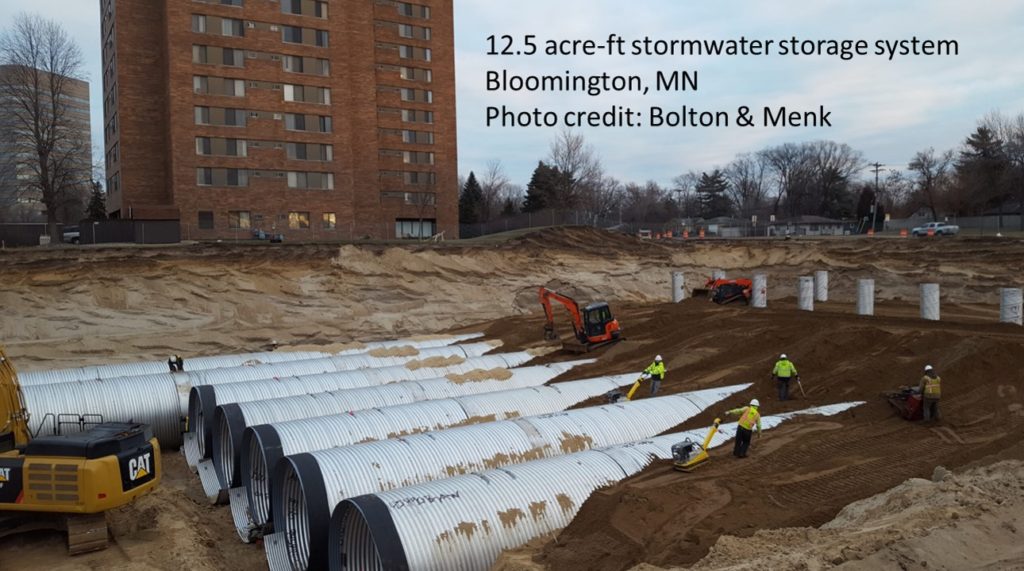
In a Minneapolis suburb, a wetland complex had been paved over for commercial development prior to the passage of the Clean Water Act. The water the wetlands used to store was regularly backing up into the streets: a 4 inch rain caused 3 feet of flooding). A new transit line opened up some redevelopment opportunities, but the water the wetlands used to store had to go somewhere, so they put it in massive underground chambers. The project included a lot of clever engineering to detain and treat the water within a limited footprint, and a lot of innovative construction to get it installed while keeping the restaurants and stores open, but it came at a cost of $10 million.

A highlight of the conference was seeing Tracy Peterson (who’s helped us with many watershed projects and events) get an award. As an engineer for the City of Ames, Tracy regularly deals with the consequences of past development on rivers in the City of Ames, overseeing projects to reduce flooding on South Duff, clean up runoff on Welch Ave, and control erosion on the South Skunk River and Ioway Creek.

Bottom line, when developers are allowed to pave over wetlands and streams without limit and without mitigation, we pay for it later with flooded basements or big infrastructure projects. There’s a debate to be had over what level of government has the authority to regulate construction in wetlands and waterways and how we should balance the competing interests, but that’s not the debate we’ve had.  For a decade, some politicians and interest groups have been claiming that an expanded definition of WOTUS is a threat to farmers. I don’t get it.

stormwater project in Bloomington, MN

In a previous job, I had the pleasure of reading boxes of old permit files and learning about what kinds of activities require a federal dredge/fill permit or state water quality certification.  As I recall, farming activities are exempt except for cranberry bogs (this was Wisconsin) and some new drainage ditches.  Best I can tell, this issue isn’t really about farmers, it’s about developers. It’s not really about water quality, it’s about flash flooding. It’s not really about the EPA, it’s about the US Army Corps of Engineers (correction: the USACE issues the permits, but the EPA enforces violations). It’s not just about federal overreach, it’s also about state under-reach.

This election season, remember the true meaning of WOTUS.  wink

Weather Whiplash Returns!

Weather Whiplash Returns!

“If it never rained, we’d have great water quality in Iowa.”

-Jim Richardson

“If it never rained, we’d have great water quality in Iowa,” joked a volunteer at our May 15 water quality snapshot. 15 of us spent the morning testing Ioway Creek and its tributaries in Boone, Hamilton, and Story County and were marveling at the low nitrate levels and crystal clear water at the majority of our sites.

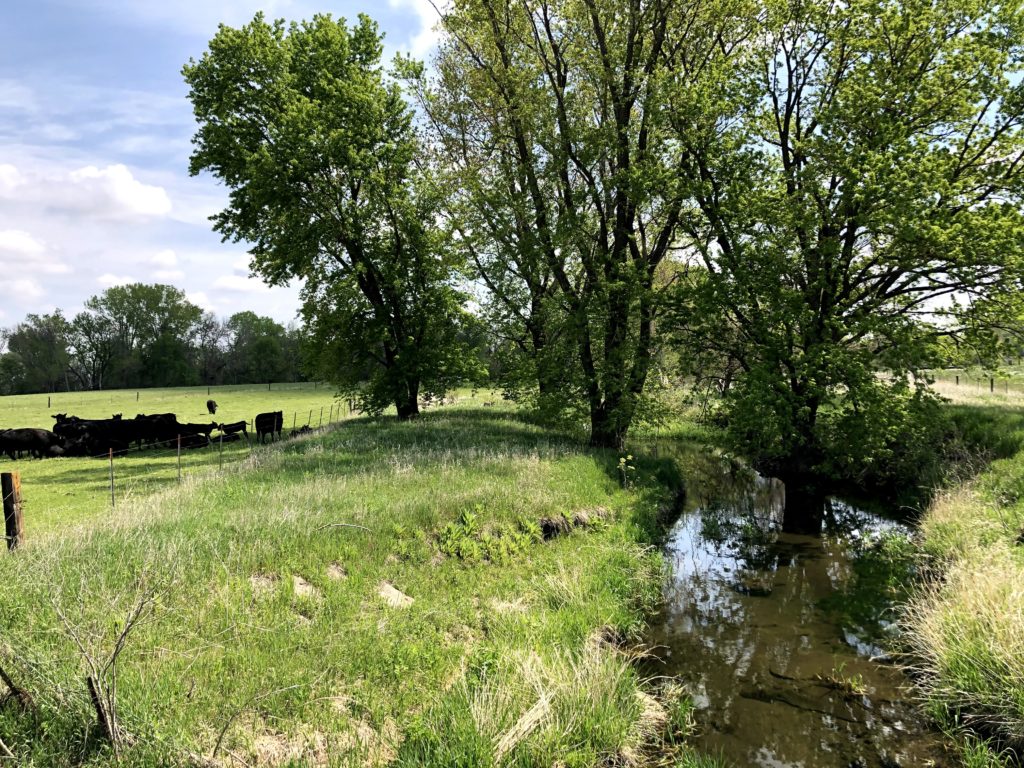
I wish more creeks in central Iowa were like this spot in Boone County. Cows fenced out the creek, a CREP wetland upstream keeping nitrate levels low, orioles and a kingfisher flitting between the trees.

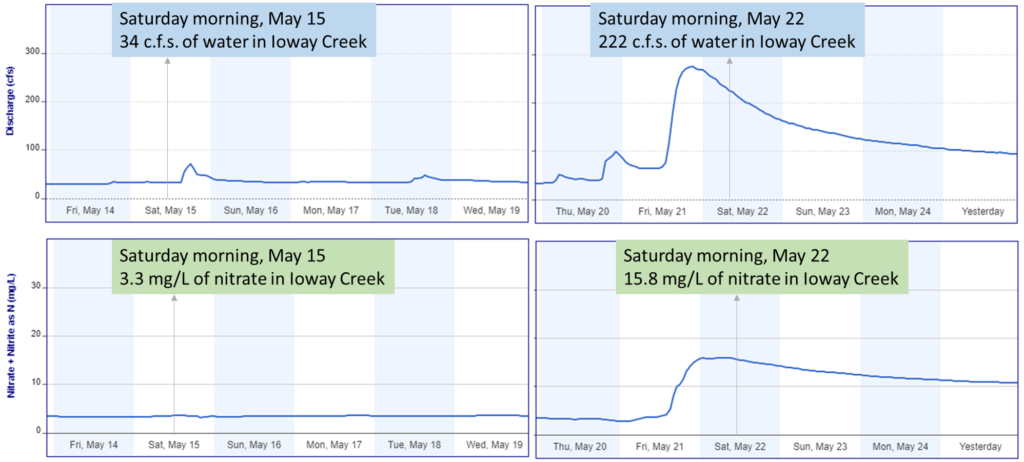
Well, we’ve had some much-needed rain in the week since, and water quality has gone from good to bad. I’ve written before about “weather whiplash” that explains some of the big swings in nitrate over the past decade and here’s an early hint of it. Here’s data from a nitrate sensor in Ioway Creek installed by IIHR-Hydroscience and Engineering. A five-fold increase in nitrate concentrations in just one week! The water has gone back down but the nitrate levels are still above the drinking water standard.

Graph showing a big increase in flow and nitrate levels after a rain storm

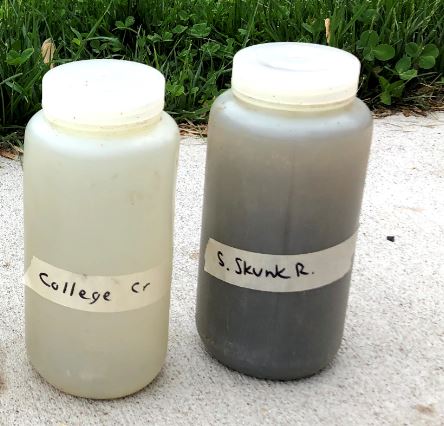
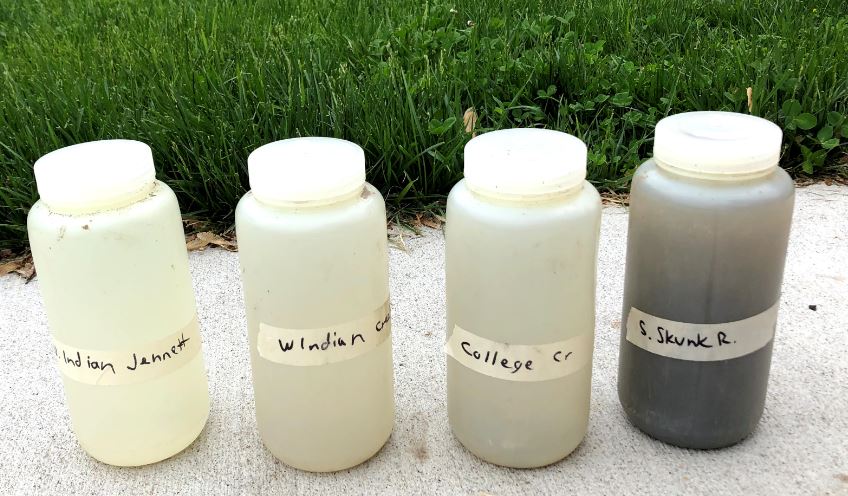
And here’s some water samples I collected on Friday May 21. No, that’s not my coffee thermos, that’s some of the world’s best top soil washing down the Skunk River!

Four samples collected May 21, after a 3/4 inch rain

That’s not to blame the weather. It does rain in Iowa and if your farming practices let a plume of topsoil, manure, or fertilizer wash off the field every time that happens, you’re doing it wrong! Some farmers are doing it right (I saw some cover crops this spring near Nevada and lots driving on I-80) but not enough, especially in the Ioway and South Skunk River watersheds.

Water quality monitoring has been top of mind for Prairie Rivers of Iowa lately and I see an challenge and an opportunity. It’s a challenge to interpret data and track our progress when one good rain can cause water quality to go from clear to coffee-colored overnight! There’s an opportunity to be more strategic about how and where we test, so we notice and communicate more eye-opening moments like this one, and hopefully persuade a few more people to protect soil and water.

Update: June has been abnormally dry and Hamilton, Boone and Story County are experience severe drought. Droughts stress is impacting crops and smaller streams are drying up.