Watershed Matchups
by Watershed Educator Dan Haug
These matchups were developed as a series for 2019 Watershed Awareness Month, comparing water quality in a pair of local creeks to learn how land and people influence water.
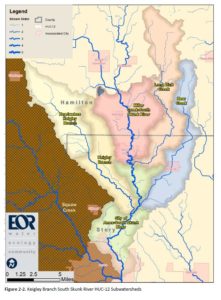
Long Dick Creek and Bear Creek both start east of Ellsworth and join the South Skunk River between Story City and Ames. Both have agricultural watersheds with thousands of acres in both Story county and Hamilton county. Yet one is dirtier than the other. You might wonder why…
Hey! Wipe that smirk off your face!
“Long Dick” was the unfortunate nickname of a tall guy named Richard who explored the land near the creek when it was still wild prairie. “Bear Creek” was named because an early settler shot a black bear nearby. Since the 1860s, the prairie and the bears have disappeared and the man’s nickname has acquired other meanings, but we at Prairie Rivers of Iowa are serious about our water and our history and will have no giggling, thank you very much! If you have a problem with “Long Dick Creek”—or for that matter, “White Breast Creek,” “Squaw Creek“, or “Drainage Ditch 5″—you can follow the example of Newton High School and take it up with the US Board on Geographic Names.
Anyway, I was out doing some water testing this week and noticed some pretty high nitrate levels in Bear Creek (10mg/L) and even higher nitrate in Long Dick Creek (20 mg/L) . The same pattern held when I sampled in June of last year, using more precise equipment: 13mg/L in Bear Creek and 21 mg/L in Long Dick Creek. For reference, the drinking water standard for nitrate is 10 mg/L.
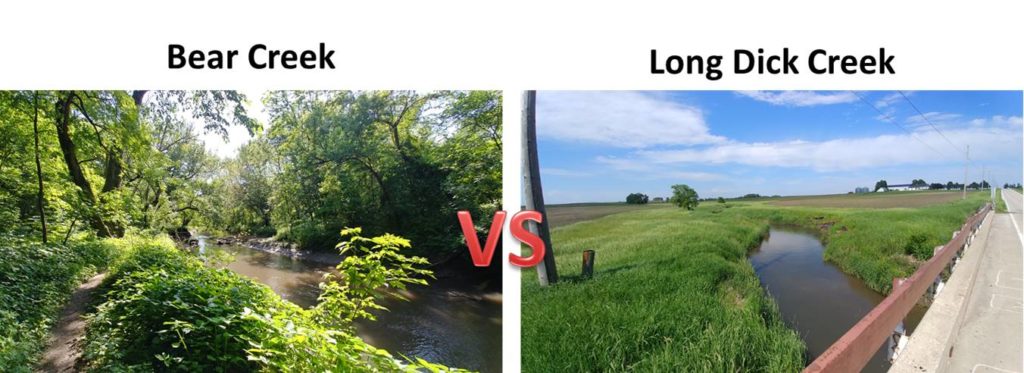
These are similar creeks with similar watersheds, although Long Dick Creek does have more livestock. I will wager that the difference is what’s been done in the land along the stream. For over a decade, researchers at Iowa State University have worked with farmers along Bear Creek to plant riparian buffers, study their effectiveness, and share the lessons nationwide. Long Dick Creek is pretty typical for Iowa streams. The stretch pictured (at 115th St) has a nice grass buffer, but there are other stretches without much space between the crop field and the water. Doing some quick GIS analysis with 2011 landcover, it looks like Bear Creek has more buffers, wider buffers, and better buffers, and that seems to have made a difference for water quality.
| Long Dick Creek | Bear Creek |
| 23,500 acre watershed | 18,500 acre watershed |
| 90% cropland in the watershed | 86% cropland in watershed |
| 116,919 animal units of swine in watershed | 32,536 animal units of swine in the watershed |
| 147,500 animal units of poultry in watershed | 18,000 animal units of poultry in the watershed |
| 73% cropland within 100m of creek | 63% cropland within 100m of the creek |
| 2% forest within 100m of creek | 8% forest within 100m of creek |
| 6% grassland within 100m of creek | 11% grassland within 100m of creek |
| 8% pasture within 100m of creek | 8% pasture within 100m of creek |
| 21 mg/L nitrate (June 16, 2018) | 13 mg/L nitrate (June 16, 2018) |
| 0.8 mg/L orthophosphate | 0.6 mg/L orthophosphate |
Prairie Rivers of Iowa recently received a grant from the National Fish and Wildlife Foundation that will give us an opportunity to talk with landowners near Long Dick Creek and two other small watersheds about conservation practices that benefit both wildlife and water quality. We may never see a bear along Bear Creek (and I’ll bet the residents of Roland are fine with that), but with a few more prairie plantings to provide habitat, we’d have a good reason to rename the little stream east of Story City to “Long Dickcissel Creek.”
Male dickcissel (photo credit: Rebel At on Wikipedia)
| Clear Creek @Hyland on May 18 | Clear Creek@ Hyland on May 24 |
| Transparency > 60 cm | Transparency of 1 cm |
| Orthophosphate 0.1 mg/L | Orthophosphate 5 mg/L |
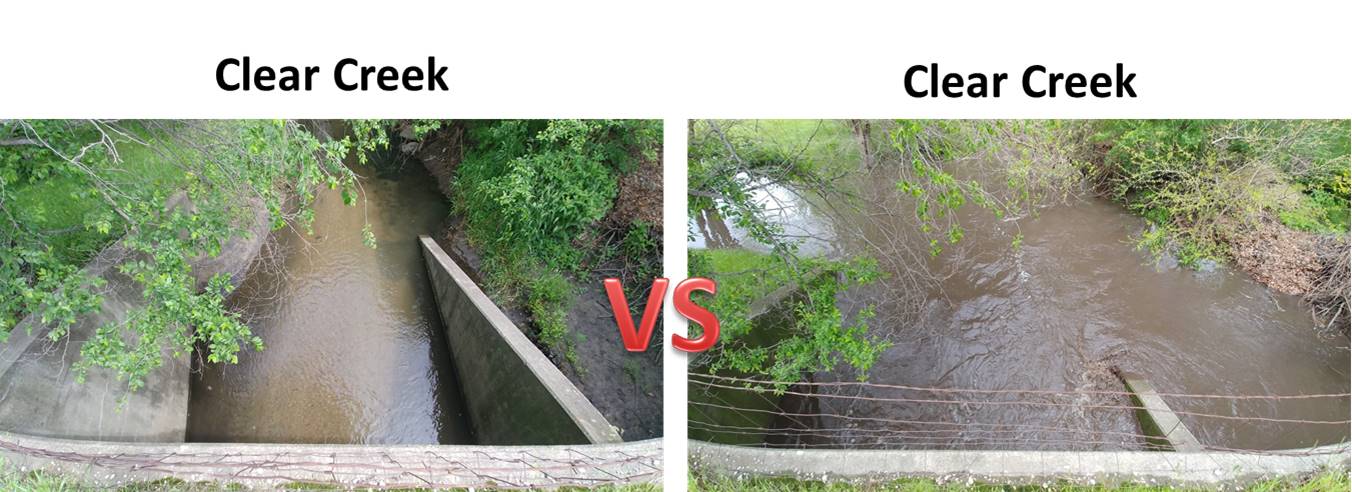
Clear Creek was true to its name on May 18 when the Squaw Creek Watershed Coalition did its spring water quality snapshot. Long-time member Ed Engle and three Ames High School students (Wil, Becca, and Nate) filled a transparency tube to the top (60 cm) and the secchi disk at the bottom was clearly visible. A week later, Rick Dietz tested the same location after a 1.7 inch rainstorm and couldn’t see the disk until he’d poured out all but 1 cm of the water!
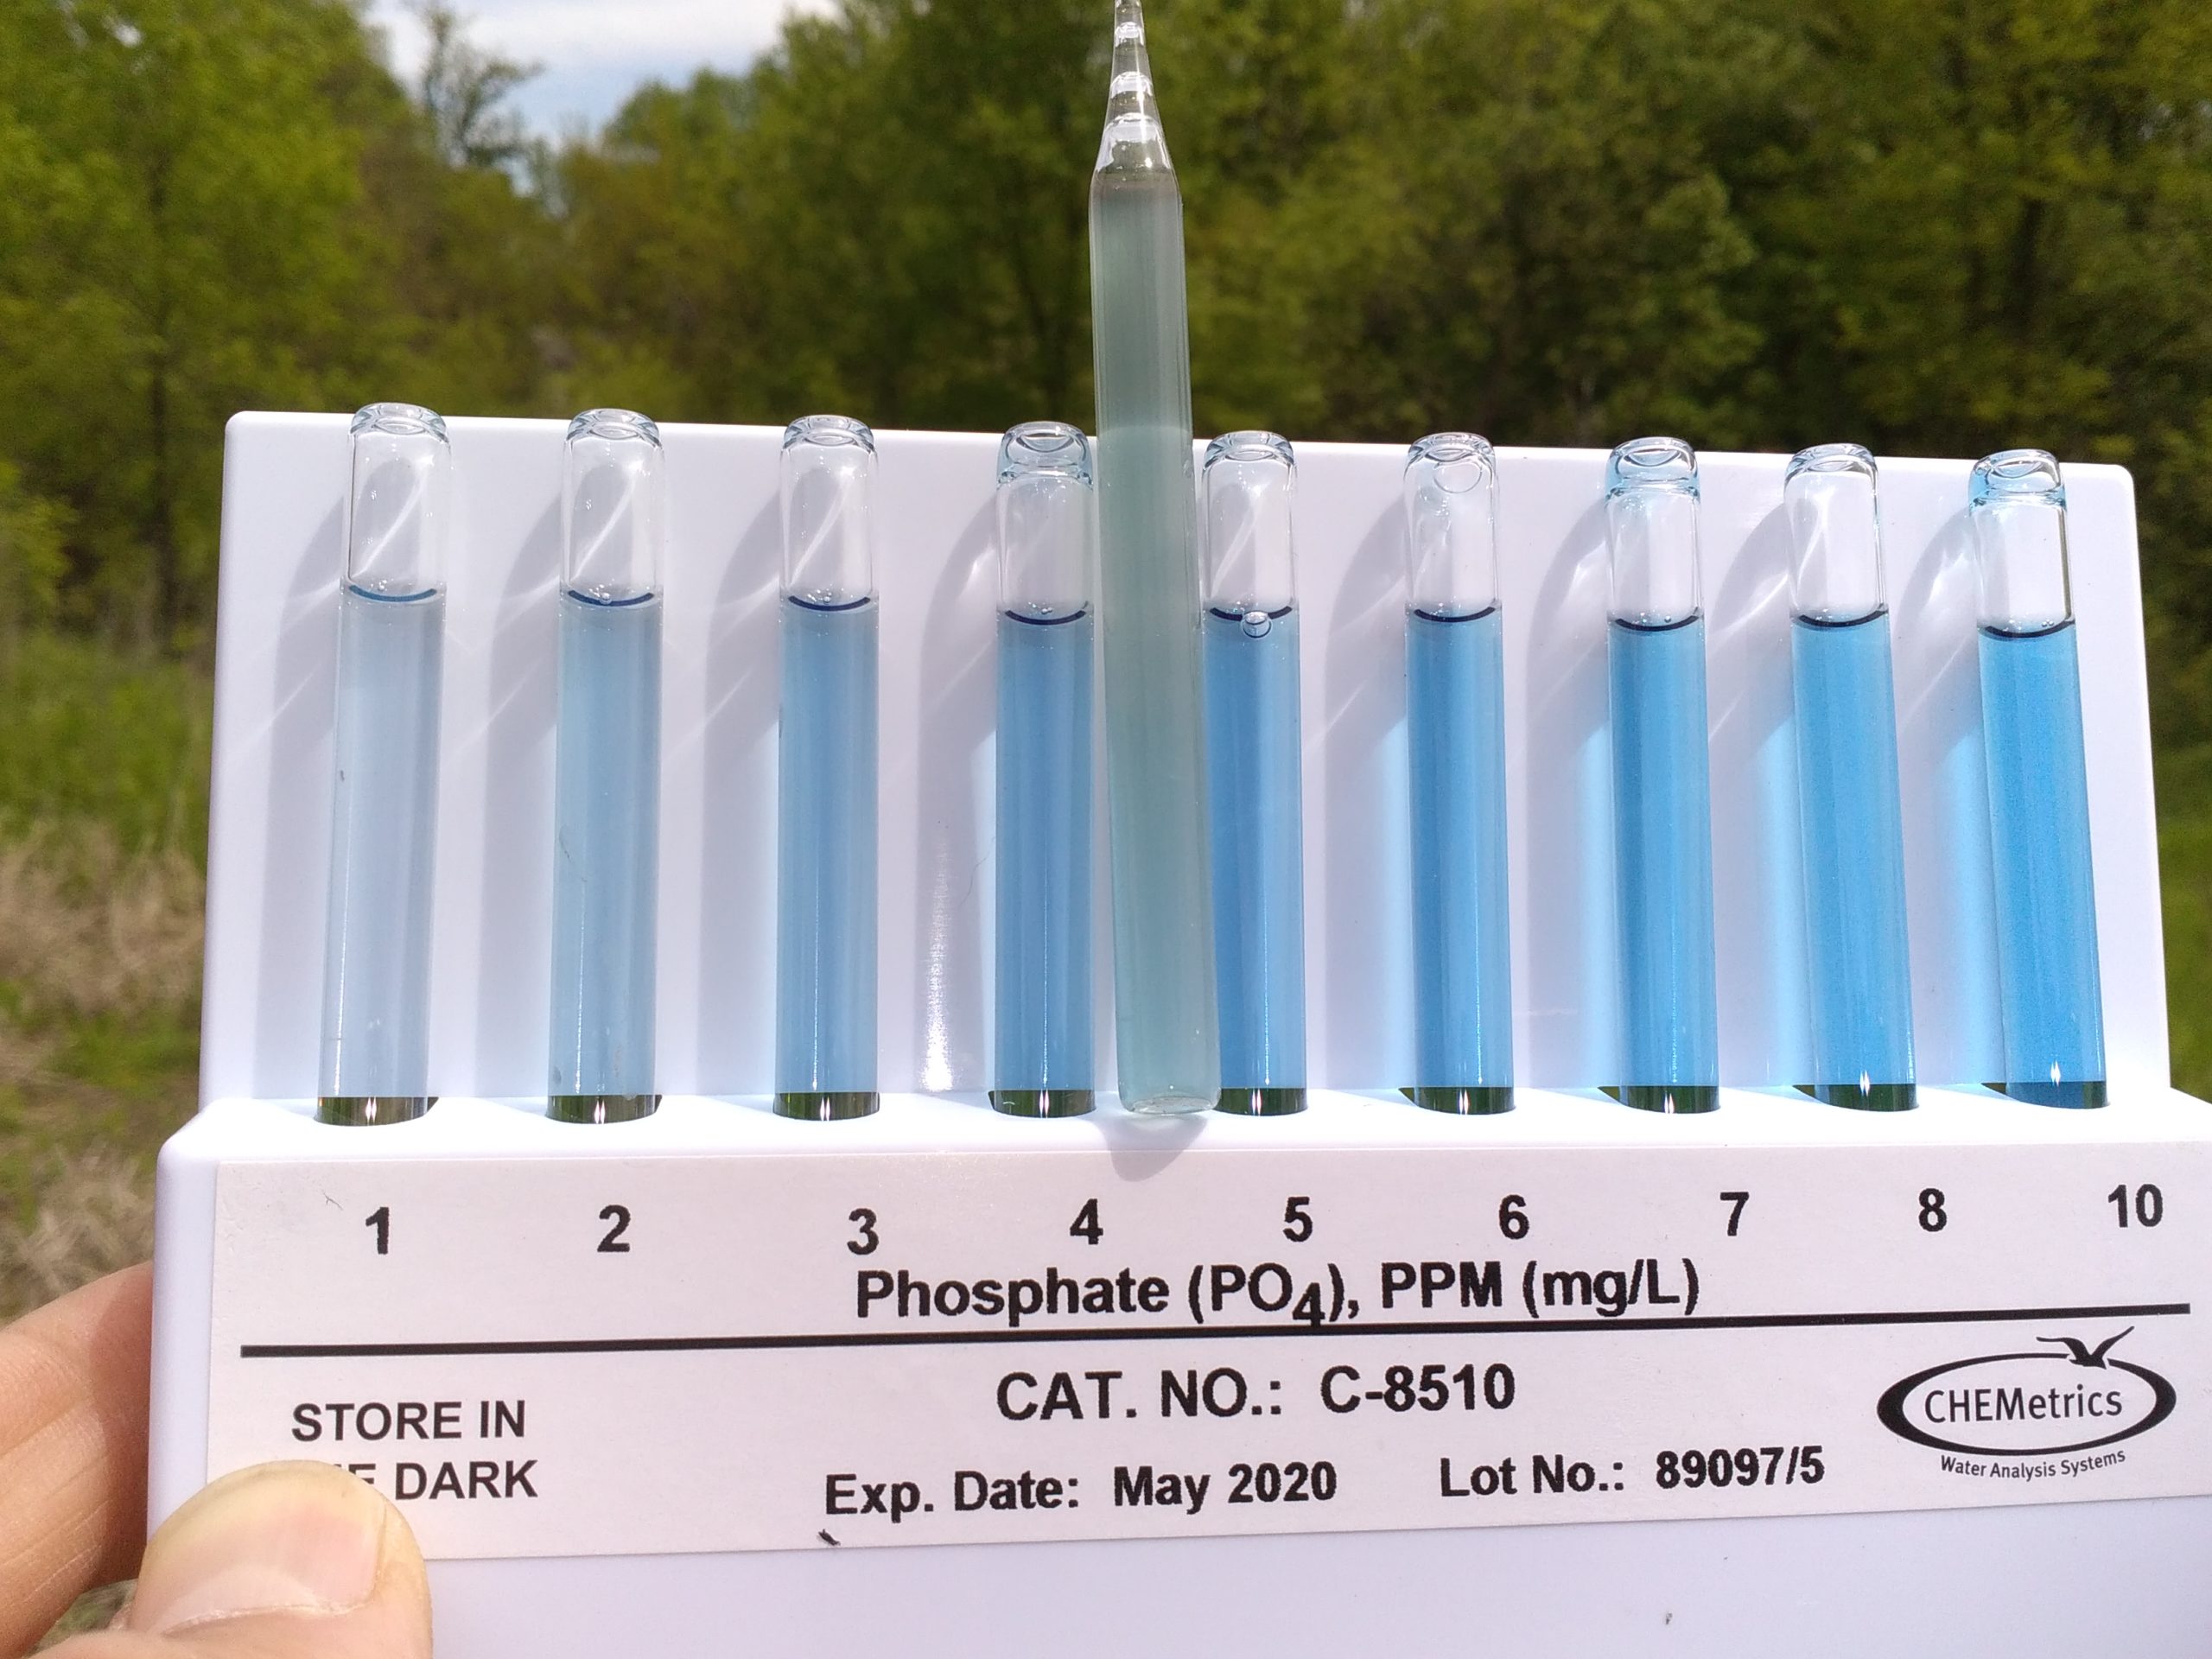
Phosphorus in Clear Creek was high enough we had to break out the high range comparison vials!
Water quality can change rapidly. Sediment* in the water spikes during and after a big rain storm. So does phosphorus and E. coli. Nitrate and chloride show strong seasonal patterns. While some of that variation may average out in a big dataset, when streams are sampled less often, it can be tricky to make an apples-to-apples comparison. That’s why water quality snapshots—multiple streams sampled on the same day—are so valuable.
*measured as clarity, turbidity, or total suspended solids
The Coalition has been monitoring Clear Creek since 2007. It normally has pretty good water quality, with orthophosphate near the outlet averaging 0.2 mg/L and transparency averaging 43 cm. 23% of the riparian area is forested (Pammel Woods, Munn Woods, and Emma McCarthy Lee Park) so that’s part of the reason. Another reason is the efforts of some farmers in the watershed. Jeremy Gustafson has been improving his soil and protecting water through his innovative use of cover crops–planting soybeans into living rye and using diverse mixes after oats.
Still, there’s room for improvement. Nitrate levels average 5.7 mg/L in Pammel Woods, and 7.5 mg/L at the Boone-Story county line. (For reference, nitrate was historically less than 2 mg/L). And as the “gully washer” of May 24 shows, the relatively flat “Des Moines Lobe” region of Iowa is not immune to soil erosion! More no-till, cover crops, and prairie strips could further reduce erosion. More sediment ponds, wetlands, and buffers could prevent sediment from reaching the creek.
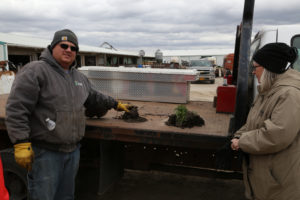
Farmer Jeremy Gustafson shows members of the Squaw Creek Watershed Management board how cover crops have improved his soil.
A creek sign on the Lincoln Heritage Byway (Ontario Rd near the county line)! You can’t get more Prairie Rivers of Iowa than that! The creek was out of its banks.
Clear Creek, College Creek, and Worrell Creek all start in Boone County and join Squaw Creek in Ames. We’ll continue to support conservation practices in these watersheds through our landowner assistance project and our National Fish and Wildlife Foundation grant. If you live or farm west of Ames and are thinking about conservation, or know someone who does, give us a call!
With such a big watershed—147,000 acres—we’ll need the help of a lot of people to improve water quality in Squaw Creek. However, some of the people I talk to assume that water quality is mostly someone else’s problem—it’s the CAFOs fault, or the golf courses, or the residential lawns.
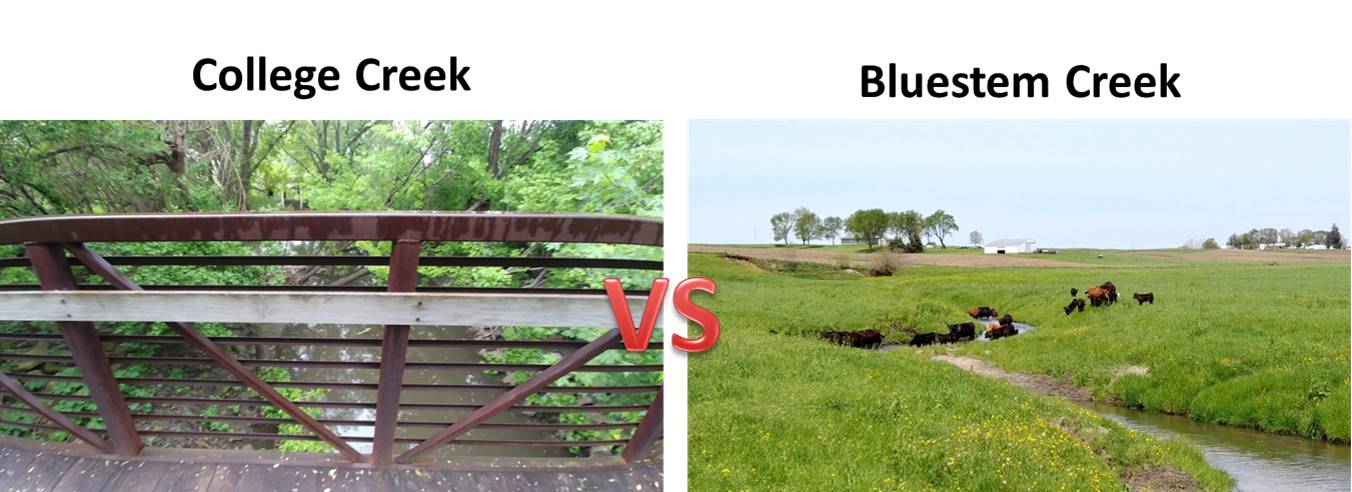
By comparing smaller streams, volunteer monitoring can help us untangle some of the influences and serve as a reality check on the finger-pointing. Thanks to the Squaw Creek Watershed Coalition we have some data on a lot of Squaw Creek’s tributaries, some with urban watersheds (College Creek) and some with rural watersheds, some with hog barns (Prairie Creek) and some without (Bluestem Creek). Some streams were even sampled monthly for a few years—not always the same years, but I’ve included some monthly averages to show the seasonal pattern.
| May 2019 Snapshot | Bluestem Creek | College Creek | Prairie Creek | Squaw Creek @Duff Ave |
| Cropland in watershed | 90% | 19% | 82% | 81% |
| Nitrate | 5 mg/L | 2 mg/L | 5 mg/L | 5 mg/L |
| Phosphorus | 0.8 mg/L | 0.2 mg/L | 0.3 mg/L | 0.2 mg/L |
| E. coli | Not sampled | 1,220 CFU/100mL | 11,700 CFU/100mL | 9,600 CFU/100mL |
College Creek is almost entirely within the city of Ames. Urban streams have their own set of water quality challenges. Road salt applied in winter can lead to elevated levels of chloride. E. coli levels used to be very high due to issues with septic systems. Paved surfaces mean more runoff after heavy rains, carrying contaminants, and worsening bank erosion. (A 2019 Water Quality Improvement project to install permeable pavement and tree trenches on Welch Ave will help reduce runoff to College Creek).
But despite all the athletic fields and residential lawns in the watershed, College Creek typically has lower nitrate levels than rural tributaries. If you’ve seen your neighbor over-fertilize their lawn and are wondering why that doesn’t have more of an impact, it’s worth remembering that turfgrass is a perennial and, like a good cover crop, is actively growing and taking up nutrients in April and May when most fields are bare.
Bluestem Creek is located in rural Boone County. It is usual in that it has no nearby hog barns, and presumably, no hog manure applied in the watershed. It contributes plenty of nitrogen to Squaw Creek but appears to have lower phosphorus levels than Prairie Creek, another rural tributary with at least two hog confinements in its watershed. Hog manure is a good fertilizer (adding nitrogen, phosphorus, and organic matter to the fields where it is applied) but farmers don’t always account for it when applying commercial fertilizer.
Bluestem Creek does have cows, which entered the water for 5 minutes while I was doing water testing this spring. I have a soft spot for cows because their presence on the landscape can make cover crops and more diverse crop rotations financially viable. I’d rather see pasture along the creeks than have it plowed right up to the edge. But it’s true that cows can stir up sediment and poop in the water if they have access to the creek. I’ve heard feedlot owners complain that they have to fill out a lot of paperwork regarding their manure management and receive a lot of scrutiny from their neighbors, while smaller livestock producers are not held to the same standard.
Ultimately, I think stream monitoring data shows that we all have a role to play in improving water quality, whether that’s reducing runoff and erosion in urban streams through rain gardens and permeable pavement, improving soil health with cover crops and no-till, better management of manure and fertilizer, or removing nitrogen from drainage water with bioreactors and saturated buffers.
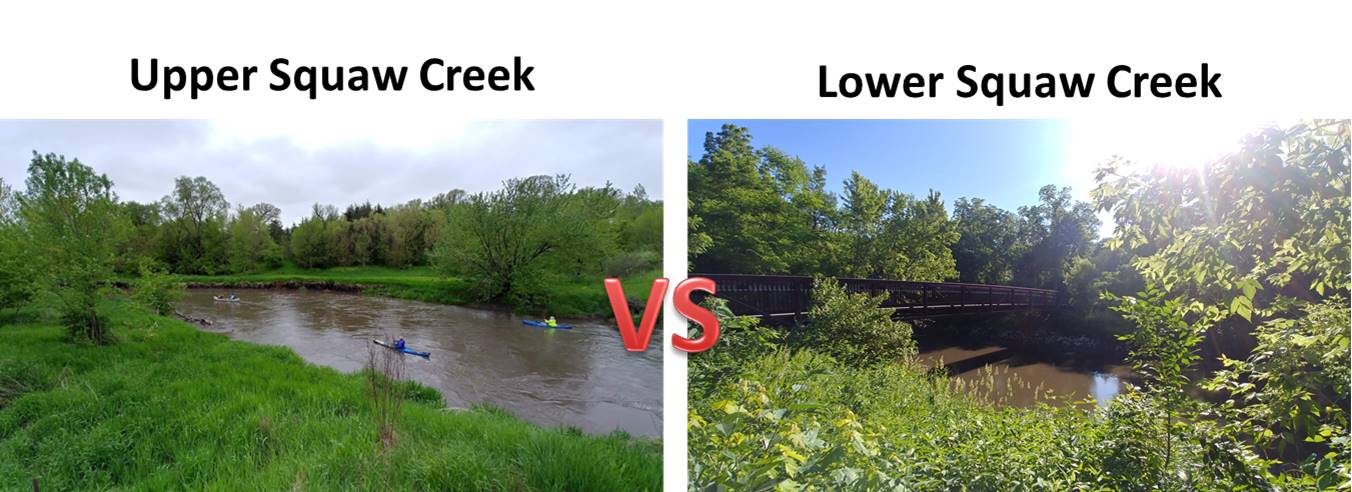
On May 20, the Skunk River Paddlers launched their canoes and kayaks on Squaw Creek at 100th Street in Hamilton County and paddled down to 140th St in Boone County. The recent rains made it a fast ride!
Update: The name “Squaw Creek” was officially changed to “Ioway Creek” in February of 2021, to be more respectful to native peoples. Over the next year, expect to see some changes to the names of groups that have formed to protect the creek, as well as maps and signs.
However, the rain also washed a lot of sediment and quite likely some land-applied manure into the stream. I collected a water sample just before I took this photo and had a lab test it for E. coli bacteria, an indicator of fecal contamination: 2,390 CFU (Colony Forming Units)/100mL. That’s 10 times the primary contact standard for a single sample (235 CFU/100mL) and just shy of the secondary contact standard (2880 CFU/100mL).
Later that day, I collected a sample from Brookside Park in Ames with the help of my son. The lab results came back at 12,800 CFU/100mL, well above the secondary contact standard!
I don’t want to discourage people from recreating in Squaw Creek but I think a safety reminder is necessary:
Squaw Creek has consistent fecal contamination that could pose a risk of acquiring a waterborne illness. The risk is higher after heavy rains when the water is muddy—consider wearing waterproof boots when wading under these conditions. If you come into contact with the water, wash your hands or apply hand sanitizer before eating and take precautions to avoid getting river water in your mouth or on an open cut.
The numbers above are high, but not unprecedented. Over the past three years, City of Ames staff have been tracking E. coli, nitrogen, and phosphorus in Squaw Creek at Lincoln Way and we’ve been sharing the data on our website. 46 out of 48 samples exceeded the primary contact standard for E. coli!
The pattern is also not unusual. In our Snapshots, we see that Squaw Creek usually exceeds the standard by the time it reaches Ames and picks up additional fecal contamination by the time it reaches Duff Ave.
The Ames City Council, Public Works Department, and Water & Pollution Control Department are concerned by the data and committed to helping find and address sources of contamination within city limits. The City of Ames spends $3.5 million a year repairing and upgrading its sanitary sewers. However, the data point to multiple sources of E. coli that will make this a difficult problem to solve. In addition to sewer leaks, we probably have some failing septic systems in the upper watershed, cattle in the stream, land-applied manure carried by runoff, pet waste, and wildlife. E. coli can also persist for a while in the sediment, and gets stirred up again after a rain.
In June, I went back to Brookside Park to demonstrate some water quality testing for kids enrolled in the Community Academy summer program. In addition to exploring nature and food systems, the kids have been hard at work improving removing invasive species, planting pollinator gardens, improving trails, and coming up with interpretive signs for Brookside Park. I’m pleased to see that one of the signs is about water quality, including a reminder to wash your hands after entering the creek, and tips on how to reduce pollution. Look for the signs to go up later this summer.
GIS mapping is a big part of my job, but I’ll be the first to admit there’s a limit to what you can learn about a stream without getting your feet wet, or at least dipping a bucket into the water.
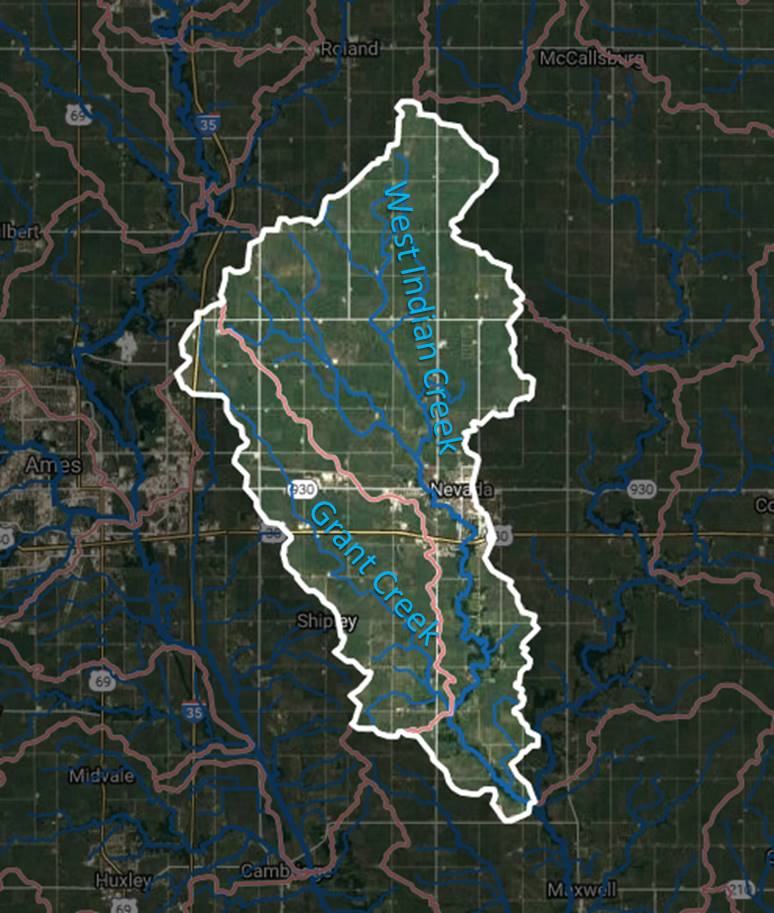
I’ve been testing West Indian Creek and Grant Creek at the lovely Jennett Heritage Area, just above their confluence. (With some help from David Stein and Rick Dietz) West Indian Creek flows through Nevada and drains 28,417 acres at this point. Grant Creek, also known as Drainage Ditch 5, drains 13,344 acres between Ames and Nevada.
Based on soils and landcover in the watershed, I’d expect Grant Creek to have comparable or slightly worse water quality than West Indian Creek. There are nutrient loading models available online and in the Story County Watershed Assessment that predicts just that.
Instead, I’ve found that water quality is consistently better in Grant Creek. West Indian Creek has normal nitrate levels but very high phosphorus levels. At this point, I don’t know why.
| Orthophosphate (mg/L) | Grant Creek | W. Indian Creek |
| 5/14/2019 | 0 | 0.6 |
| 6/11/2019 | 0.1 | 1.0 |
| 7/25/2019 | 0 | 3.0 |
| 9/10/2019 (after rain) | 0.6 | 4.0 |
| Nitrate (mg/L) | Grant Creek | W. Indian Creek |
| 5/14/2019 | 2 | 5 |
| 6/11/2019 | 2 | 5 |
| 7/25/2019 | 2 | 5 |
| 9/10/2019 (after rain) | 0 | 0 |
I do know there are people in the West Indian Creek watershed working to improve water quality, both on private land and public land. If you own land or farm in the watershed and are thinking about doing more to conserve soil and water, or want to help solve the mystery of these two creeks through water testing, contact us.
A final note: Don’t judge a stream by its name, or lack of a name. The lower part of Drainage Ditch 5 is a natural creek with buffer vegetation, fish, clean water, and public access. The map below shows a pre-settlement land survey superimposed over a current topographic map. Interestingly, West Indian Creek was forested while Grant Creek was prairie. Thanks to the restoration efforts of Cindy Hildebrand and Roger Maddux, parts of Grant Creek are prairie once again.

